No bother feel no way
It’s coming close pay day I say
No bother feel no way
Every man get paid accord his work this day
It’s coming close pay day I say
Every man get paid accord his work this day
It’s coming close pay day I say
From “Feel No Way”, by Peter Tosh, 1983
INCREASING AIR AND WATER CLARITY AND QUALITY - THE DATA, AND THE BULLSHIT PLAUSIBLE-DENIABILITY EXCUSES REFUTING IT
From 2005 to 2013, 1-Hour Sulfur Dioxide (SO2) Design Values for Brown County, Wisconsin remained perfectly flat, at 75 parts per billion.
From 2013 to 2018, 1-Hour Sulfur Dioxide (SO2) Design Values for Brown County, Wisconsin**decreased by 84%**from 2013 to 2018, or reduced by nearly half, from 75 parts per billion to 12 parts per billion.
From 2014 to 2021, strong evidence of cyanobacteria blooms on Lake Kegonsa in Wisconsin decreased by 25% , from 14% to 10.5%
From 2016 to 2020, 8-hour Ozone design values in Brown County, Wisconsin decreased by 5%, from 65 parts per billion to 62 parts per billion. that’s an average decrease of 1.25% over each of those 4 years.
From 2017 to 2021, the water clarity of Lake Wingra in Wisconsin increased by 45% , from 70.5 centimeters to 102 centimeters.
From June 2018 to June 2020, the number of days with one or more reports of strong cyanobacteria blooms each month across all Yahara lakes decreased by 68% , from 25 to 8.
From 2019 to 2020, European reporting stations that registered concentrations above the EU daily limit value of 50 ug/m3 decreased by decreased by 28.3%, or decreased by almost one third, from 14% to 10%.
From 2019 to 2020, European reporting stations that registered concentrations above the WHO long-term guideline of 20 ug/m3 decreased by 21% from 43% to 34%.
The uncredited author from eea.europa.eu said sudden, exponential increase in air quality in Europe in 2019 was due to “The apparent improvement in the situation in 2020, with lower concentrations of PM10, PM2.5 and NO2, is partly due to the lockdown measuresimplemented during the outbreak of the COVID-19 pandemic.”
From 2021 to 2022, air quality in China increased by 10% "
From 2020 to 2021, ice cover days on Lake Mendota in Wisconsin increased by 9%, from 70 days to 77 days.
The uncredited author from the Clean Lakes Alliance described it as “only seven days longer”, and that “the winter leading into the 2021 summer monitoring season was relatively warm.”
**Essay:**describe how a “relatively warm winter” could cause a 9% increase in ice cover days.
From 2021 to 2022, Ozone levels in China decreased by almost one percent.
Editor Li Yan said that the air quality in China increased suddenly and exponentially in 2021 because “the country continued its efforts to ensure air quality”.
The 1.25% average annual decrease in Ozone in Brown County, Wisconsin from 2016 to 2020 is very close to the 1% decrease in Ozone in China in 2021.
THE ARTICLES
In 2021, cleanlakesalliance.org published “2021 Water Quality Monitoring Results”.
Where the uncredited author wrote a completely neutral headline, “Water Quality Monitoring Results”, to obscure the fact that the article is, in fact, about exponentially increasing water quality in Lake Mendota, Lake Monona, Lake Waubesa, Lake Kegonsa and Lake Wingra in Wisconsin. That’s an example of the propaganda technique known as “compartmentalization”.
I hate to be the one to break it to you, but anytime an author is uncredited, it is proof that said author is an Intelligence asset.
In a time honored propaganda technique, what little salient data the article provides is, in journalistic parlance, “buried” in tables below.
They’re all unsearchable .pdf files, from which I had to tortuously manually transcribe the data, and then do the math to learn that from 2014 to 2021, strong evidence of cyanobacteria blooms on Lake Kegonsa in Wisconsin decreased by 25% , from 14% to 10.5%.
From June 2018 to June 2020, the number of days with one or more reports of strong cyanobacteria blooms each month across all Yahara lakes decreased by 68%, from 25 to 8.
From 2017 to 2021, the water clarity of Lake Wingra in Wisconsin increased by 45%, from 70.5 centimeters to 102 centimeters.
From 2020 to 2021, ice cover days on Lake Mendota in Wisconsin increased by 9%, from 70 days to 77 days.
The uncredited author from the Clean Lakes Alliance described it as “only seven days longer”, and that “the winter leading into the 2021 summer monitoring season was relatively warm.”
Essay: describe how a relatively warm winter could cause a 9% increase in ice cover days.
In 2021, dnr.wisconsin.gov published “Wisonsin’s Air Quality Trends”.
Where the uncredited author wrote a completely neutral headline, “Wisconsin’s Air Quality Trends”, to obscure the fact that the article is, in fact, about exponentially increasing air quality in Wisconsin. That’s an example of the propaganda technique known as “compartmentalization”.
I hate to be the one to break it to you, but anytime an author is uncredited, it is proof that said author is an Intelligence asset.
The article goes on to say “As part of its effort to meet CAA requirements, the DNR released the 2021 Wisconsin Air Quality Trends Report - data through 2020 (AM-599) [PDF]. The report shows that the overall air quality in Wisconsin continues to improve, building on a 20-year trend in the state.”
Where “building on a 20-year trend” is smoke to cover the sudden, exponential increase in air quality that took place in Wisconsin in 2021. The sudden, quantum increase in air clarity that, to this moment, is still hidden further still by the hedging generality “continues to improve”.
In a time honored propaganda technique, what little salient data the article provides is, in journalistic parlance, “buried” in a table below.
Here’s the header of the table:
“To view charts that show the air quality trends in each county, see the 2021 Wisconsin Air Quality Trends by County (AM-600) [PDF].”
It’s a .pdf file, which is unsearchable, and can’t be cut and pasted. So I had to tortuously transcribe the data and do the math to learn that, from 2005 to 2013, 1-Hour Sulfur Dioxide (SO2) Design Values for Brown County, Wisconsin remained perfectly flat, at 75 parts per billion, then suddenly decreased by 84%, or reduced by nearly half from 2013 to 2018, from 75 parts per billion to 12 parts per billion.
From 2016 to 2020, 8-hour Ozone design values in Brown County, Wisconsin decreased by 5%, from 65 parts per billion to 62 parts per billion.
In November 2021, eea.europa.eu said “Europe’s air quality status 2021”.
Where the uncredited author wrote a completely neutral headline to obscure the fact that the article is, in fact, about exponentially increasing air quality in Europe. That’s an example of the propaganda technique known as “compartmentalization”.
I hate to be the one to break it to you, but anytime an author is uncredited, it is proof that said author is an Intelligence asset.
In a time honored propaganda technique, what little salient data the article provides is, in journalistic parlance, “buried” in a table below.
Here’s the header of the table:
“Figure 3: Percentage of reporting stations registering PM10 concentrations above the EU daily limit value and the WHO long-term guideline in 2019 and 2020”
You can’t even copy and paste the data. It’s in a non-searchable image:
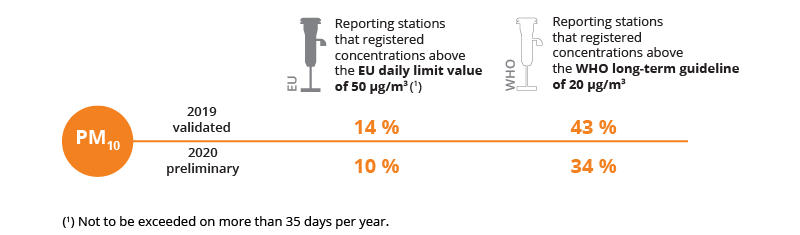
(Non searchable image of suddenly and exponentially increasing air quality data that I was forced to transcribe and then do the math to learn)
So I had to scroll down to the table, transcribe the text, and do the math to learn that, from 2019 to 2020, European reporting stations that registered concentrations above the EU daily limit value of 50 ug/m3 decreased by decreased by 28.3%, or decreased by almost one third, from 14% to 10%.
And that European reporting stations that registered concentrations above the WHO long-term guideline of 20 ug/m3 decreased by 21% from 43% to 34%.
Why, what could have caused this sudden, see-the-needle-moving, quantum increase in air quality in Europe?
The article goes on to say “The apparent improvement in the situation in 2020, with lower concentrations of PM10, PM2.5 and NO2, is partly due to the lockdown measuresimplemented during the outbreak of the COVID-19 pandemic.”
Ah, the social engineering surrounding the barely-covert international release of the Chinese bat virus with four amino acids added for improved transmissibility to humans, is there anything it can’t do?
In April 2022, ecns.com said “China’s air quality continues to improve in 2021”.
Where “improve” is general. The propagandist knows that, since sixty to seventy percent of readers only read the headines, this hedging generality goes a long way toward “compartmentalizes” awareness of the scope of the wider increase in air quality and clarity that I’m documenting here.
The internet post says “Editor: Li Yan”. Li is one of the most prominent Illuminist bloodlines in China. The credit as Editor is accurate, as Li Yan did not write it, but rather received it from his up-line at an Intelligence agency, and, I’m guessing, posted it verbatim.
The article goes on to say “China’s atmospheric environment saw improvement in 2021 as the country continued its efforts to ensure air quality, a meteorological official said Friday.”
Where “improvement” is, once again, only-general. With each passing paragraph, the mouth-breathing, Coincidence theorist reader in China is that much closer to turning the page without getting a clearer picture of the scope in the increase in air quality and clarity I’m documenting here.
“The country continued it’s efforts” plays the ruse that it is efforts at the local level that is causing a for-some-reason-unspecified increase in air quality, and that the increase in air quality is confined to China, which assertion is patently false. It’s another example of the propaganda technique known as “compartmentalization”.
At last, the author at last, er, coughs up “In 2021, the average density of PM2.5, a key indicator of air pollution, decreased 9.1 percent year on year to 30 micrograms per cubic meter in China, said Xue Jianjun, deputy head of the National Meteorological Center.”
That tortuously long sentence is Orwell’s “cuttlefish squirting out ink”. The author was gymnastically trying to avoid plainly stating “From 2021 to 2022, air quality in China increased by 10%”. Albeit for some as yet unspecified reason, that is, beyond the only-general “continued efforts”.
The article goes on to say “The average concentration of ozone eased 0.7 percent from that in 2020 to 137 micrograms per cubic meter last year, he added.”
That’s yet more cuttlefish ink, spewed to avoid plainly stating “From 2021 to 2022, Ozone levels in China decreased by almost one percent”. Albeit for some as yet unspecified reason, that is, beyond the only-general “continued efforts”.
If a sudden, quantum increase in air quality in Europe from 2020 to 2021 was due to “lockdown measures implemented during the outbreak of the COVID-19 pandemic”, why is nothing of the sort mentioned here?
In China’s case, the sudden, exponential increase in air quality there from 2021 to 2022 was instead attributed to the only-general “continued efforts”.
They’re both bullshit plausible-deniability excuses, put forward at the local level to keep your eyes off the wider trend of exponentially increasing air quality and clarity that is taking place regardless of culture or geography.
Jeff Miller, Honolulu, HI, April 14, 2022
If you’d like to be added to this free mailing list, or know someone who would be, please send me a note at [email protected]
You can access these articles online at Positive Changes That Are Occurring - Orgones Discussion Forums