BEDEMIR: What also floats in water?
VILLAGER #1: Bread!
VILLAGER #2: Apples!
VILLAGER #3: Very small rocks!
VILLAGER #1: Cider!
VILLAGER #2: Great gravy!
VILLAGER #1: Cherries!
VILLAGER #2: Mud!
VILLAGER #3: Churches – churches!
VILLAGER #2: Lead – lead!
ARTHUR: A duck.
CROWD: Oooh.
BEDEMIR: Exactly!
BEDEMIR: Who are you, who are so wise in the way of science?
ARTHUR: I am Arthur, King of the Britons
From “Monty Python and the Holy Grail”, written by John Cleese, Terry Gilliam, Graham Chapman, Eric Idle, Terry Jones and Michael Palin, 1973

(Graham Chapman as Arthur and Terry Jones as Bedemir discussing science, in “Monty Python and the Holy Grail”, 1975)
INCREASING WATER QUALITY AND CLARITY
Great positive changes are underway at every level of our reality. They began in earnest in 2012, and have been increasing in speed and magnitude. I began writing this series of articles, entitled “Positive Changes That Are Occurring”, in July of 2013.
These historically-unprecedented positive changes are being driven by many hundreds of thousands, if not millions of simple, inexpensive Orgonite devices based on the work of Wilhelm Reich and Karl Hans Welz.
Since Don Croft first fabricated tactical Orgonite in 2000, its widespread, ongoing and ever-increasing distribution has been unknitting and transforming the ancient Death energy matrix built and expanded by our dark masters all the way back to Babylon, and before. And, as a result, the Ether is returning to its natural state of health and vitality.
One of those positive changes is that water quality and clarity are increasing exponentially, regardless of geography.
The Orgonite-driven return to health of the Earth’s energetic or Etheric environment has as one of its byproducts increasing water clarity. Regular readers know that I’ve been documenting increasing water clarity in my articles for some time, now.
THE DATA
From the 1960’s through 2021, Lake Tahoe’s native zooplankton population decreased continuously to a record low.
From 1997 to 2014, water clarity in California’s Lake Tahoe increased by 21.3%, from 64.1 feet to 77.8 feet.
From 1997 to 2014, water clarity in California’s Lake Tahoe increased by a baseline annual average of 1.25%.
From 1997 to 1998, water clarity in California’s Lake Tahoe increased by 3.12%, from 64.1 feet to 66.1 feet.
From 1997 to 1998, the 3.12% increase in water clarity in California’s Lake Tahoe was 250% above the baseline average annual increase in clarity of 1.25% per year documented in Lake Tahoe from 1997 to 2014.
The clarity of Lake Tahoe is increasing exponentially, going forward in time.
That’s because the health of the ether is inexorably increasing, and water quality and clarity vary directly with the health of the ether.
From 1998 to 1999, water clarity in California’s Lake Tahoe increased by 4.4%, from 66.1 feet to 69 feet.
From 1998 to 1999, the 4.4% increase in water clarity in California’s Lake Tahoe was 352% above the baseline average annual increase in clarity of 1.25% per year documented in Lake Tahoe from 1997 to 2014.
The clarity of Lake Tahoe in California is increasing exponentially, going forward in time.
That’s because the health of the ether is inexorably increasing, and water quality and clarity vary directly with the health of the ether.
From 1998 to 1999, the 4.4% increase in water clarity in California’s Lake Tahoe was 41% greater than its 3.12% increase from 1997 to 1998.
The clarity of Lake Tahoe in California is increasing exponentially, going forward in time.
That’s because the health of the ether is inexorably increasing, and water quality and clarity vary directly with the health of the ether.
From 2000 to 2001, water clarity in California’s Lake Tahoe increased by 9.3%, from 67.3 feet to 73.6 feet.
From 2000 to 2001, the 9.3% increase in Lake Tahoe’s water clarity was 744% above the baseline average annual increase in clarity of 1.25% per year documented in Lake Tahoe from 1997 to 2014.
The clarity of Lake Tahoe in California is increasing exponentially, going forward in time.
That’s because the health of the ether is inexorably increasing, and water quality and clarity vary directly with the health of the ether.
From 2000 to 2001, the 9.3% increase in Lake Tahoe’s water clarity was 111% greater, or more than double its 4.4% increase from 1998 to 1999.
The clarity of Lake Tahoe in California is increasing exponentially, going forward in time.
That’s because the health of the ether is inexorably increasing, and water quality and clarity vary directly with the health of the ether.
From 2001 to 2002, water clarity in California’s Lake Tahoe increased by 6%, from 73.6 feet to 78 feet.
From 2001 to 2002, the 6% clarity increase in Lake Tahoe’s water clarity was 480% above the baseline average annual increase in clarity of 1.25% per year documented in Lake Tahoe from 1997 to 2014.
The clarity of Lake Tahoe in California is increasing exponentially, going forward in time.
That’s because the health of the ether is inexorably increasing, and water quality and clarity vary directly with the health of the ether.
From 2003 to 2023, the average size of the Chesapeake Bay dead zone decreased by 66%, or decreased by two thirds, from an all-time high 1.52 cubic miles to an all-time low .52 cubic miles
From 2003 to 2023, the average annual size of the Chesapeake Bay dead zone decreased by an annual average of 3.3%.
In 2003, the Chesapeake Bay dead zone averaged 1.52 cubic miles, the largest since record keeping began in 1985.
From 2003 to 2004, water clarity in California’s Lake Tahoe increased by 3.6%, from 71 feet to 73.6 feet.
From 2003 to 2004, the 3.6% increase in Lake Tahoe’s water clarity was 288% above the baseline average annual increase in clarity of 1.25% per year documented in Lake Tahoe from 1997 to 2014.
The clarity of Lake Tahoe in California is increasing exponentially, going forward in time.
That’s because the health of the ether is inexorably increasing, and water quality and clarity vary directly with the health of the ether.
From 2006 to 2014, water clarity in Caspian Lake, Vermont, increased by 77%, from 6.5 meters to 11.5 meters. That’s an unexplained near-doubling of water clarity in Caspian Lake in Vermont from 2006 to 2014.
From 2006 to 2014, the water clarity in Caspian Lake, Vermont increased by an annual average of 9.6%.
From 2006 to 2014, water clarity in California’s Lake Tahoe increased by 14.9%, from 67.7 feet to 77.8 feet.
From 2006 to 2014, water clarity in California’s Lake Tahoe increased by an annual average of 3%.
From 2006 to 2007, water clarity in Caspian Lake, Vermont increased by 12.3%, from 6.5 meters to 7.3 meters.
From 2006 to 2007, the 12.3% increase in water clarity in Caspian Lake, Vermont was 28% greater than its 9.6% average annual increase in clarity from 2006 to 2014.
The clarity of Caspian Lake in Vermont is increasing exponentially, going forward in time.
That’s because the health of the ether is inexorably increasing, and water quality and clarity vary directly with the health of the ether.
From 2007 to 2023, the health of the James River in Virginia increased by 26.9%, from 52 to 66.
From 2007 to 2023, the health of the James River in Virginia increased by an annual average of 1.68%.
From 2007 to 2008, water clarity in Caspian Lake, Vermont increased by 1.4%, from 7.3 meters to 7.4 meters.
In 2007, the James River Association gave the James River in Virginia a grade of 52.
From 2008 to 2009, water clarity in Caspian Lake, Vermont remained unchanged at 7.4 meters.
From 2009 to 2010, water clarity in Caspian Lake, Vermont increased by 12.1%, from 7.4 meters to 8.3 meters.
From 2009 to 2010, the 12.1% increase in water clarity in Caspian Lake, Vermont was 26% greater than its 9.6% average annual increase in clarity from 2006 to 2014.
The clarity of Caspian Lake in Vermont is increasing exponentially, going forward in time.
That’s because the health of the ether is inexorably increasing, and water quality and clarity vary directly with the health of the ether.
From 2010 to 2011, water clarity in Caspian Lake, Vermont increased by 9.6%, from 8.3 meters to 9.1 meters.
From 2010 to 2011, water clarity in California’s Lake Tahoe increased by 7%, from 64.4 feet to 68.9 feet.
From 2010 to 2011, the 7% increase in water clarity in Lake Tahoe was 560% above the 1.25% long-term baseline annual average increase in clarity there from 1997 to 2014.
The clarity of Lake Tahoe in California is increasing exponentially, going forward in time.
That’s because the health of the ether is inexorably increasing, and water quality and clarity vary directly with the health of the ether.
From 2011 to 2014, water clarity in Caspian Lake, Vermont increased by 26.3%, from 9.1 meters to 11.5 meters.
From 2011 to 2014, the average annual increase in water clarity in Caspian Lake, Vermont was 8.7%.
From 2011 to 2014, water clarity in Lake Tahoe increased by 13%, from 68.9 feet to 77.8 feet
From 2011 to 2012, water clarity in Lake Tahoe, California increased by 9.2%, from 68.9 feet to 75.3 feet.
From 2011 to 2012, the 9.2% increase in water clarity in Lake Tahoe was 736% above the baseline average annual increase in clarity of 1.25% per year documented in Lake Tahoe from 1997 to 2014.
The clarity of Lake Tahoe in California is increasing exponentially, going forward in time.
That’s because the health of the ether is inexorably increasing, and water quality and clarity vary directly with the health of the ether.
From 2013 to 2014, water clarity in Lake Tahoe increased by 10.2%, from 70.2 feet to 77.8 feet. That’s the largest one-year increase in clarity in the data set, and it’s 816% above the baseline average annual increase in clarity of 1.25% per year documented in Lake Tahoe from 1997 to 2014.
The clarity of Lake Tahoe in California is increasing exponentially, going forward in time.
That’s because the health of the ether is inexorably increasing, and water quality and clarity vary directly with the health of the ether.
From 2014 to 2023, the average June to August clarity of Lake Kegonsa in Wisconsin increased by 60%**, from 60 centimeters to 96 centimeters.
From 2014 to 2023, the average June to August clarity of Lake Waubesa in Wisconsin increased by 35.5%, from 76 centimeters to 103 centimeters.
From 2014 to 2023, the average June to August clarity of Lake Monona in Wisconsin increased by 23%, from 87 centimeters to 107 centimeters.
From 2014 to 2023, the average June to August clarity of Lake Wingra in Wisconsin increased by 20%, from 100 centimeters to 120 centimeters, the highest clarity level possible.
From 2014 to 2023, the average June to August clarity of Lake Kegonsa in Wisconsin increased by an annual average of 6.7%.
From 2014 to 2023, the average June to August clarity of Lake Waubesa in Wisconsin increased by an annual average of 3.9%.
From 2014 to 2023, the average June to August clarity of Lake Monona in Wisconsin increased by an annual average of 2.6%.
From 2014 to 2023, the average June to August clarity of Lake Wingra in Wisconsin increased by an annual average of 2.2%.
From 2014 to 2023, the average June to August clarity of Lake Mendota in Wisconsin decreased by 8%, from 87 centimeters to 86 centimeters.
From 2014 to 2023, the average June to August clarity of Lake Mendota in Wisconsin decreased by an annual average of .9%.
In 2014, researchers at U.C. Davis attributed a 10.2% increase in clarity in Lake Tahoe, the largest in history, to “the drought”. Then, in 2015, those researchers attributed a 6% decrease in clarity in Lake Tahoe to “lack of snow”.
Thus, according to researchers at U.C. Davis, low levels of precipitation both increase and decrease water clarity.
Further, in 2016, researchers at U.C. Davis attributed a 12% decrease in clarity in Lake Tahoe to “record snow and rain”.
Thus, according to researchers at U.C. Davis, both low and high levels of precipitation decrease water clarity.
Lastly, in 2017, researchers at U.C. Davis attributed a 14% increase in clarity in Lake Tahoe, the largest in history, to “the end of drought”.
Thus, according to researchers at U.C. Davis, high levels precipitation decreased clarity in Lake Tahoe exponentially in 2016 and then increased them, once again exponentially, to the highest level in history in 2017.
But, wait, there’s more. In 2019, researchers from U.C. Davis attributed a 17% increase in water clarity in Lake Tahoe, the largest one-year increase in the history of the lake, was caused by “end of drought”.
In 2014, researchers from U.C. Davis said low levels of precipitation caused Lake Tahoe’s clarity to increase exponentially to the highest level in history. Then, the very next year, in 2015, those researchers said that low levels of precipitation caused water clarity in Lake Tahoe to decrease significantly.
In 2016, researchers from U.C. Davis maintained that high levels of precipitation caused water clarity in lake Tahoe to decrease exponentially. Then, the very next year, in 2017, those researchers said that high levels of precipitation caused water clarity in Lake Tahoe to increase exponentially, to the highest level in history.
Then, two years later, in 2019, those researchers from U.C. Davis said that high levels of precipitation caused water clarity to increase exponentially, by the largest margin in history, to the highest level in history. increased clarity there exponentially once again, by the largest margin in history, to the highest level in history.
I have exposed the duplicity of the researchers at U.C. Davis by using what was known in the old days as “fact checking”.
In 2014, Lake Tahoe’s clarity of 77.8 feet was second only to the historical high of 78 feet seen in 2002.
2002 is right when the literal forest of what we call “wireless communications infrastructure” was thrown up suddenly virtually overnight in every city, town and village on Earth.
In 2014, U.C. Davis researchers attributed the 10.2% year-over-year increase in the clarity of Lake Tahoe, which was the largest one-year increase in clarity in Lake Tahoe in history, to “the drought”.
From 2015 to 2018, water clarity in Iowa’s storm lake was said to have “increased”.
DNR Fisheries Biologist Ben Wallace said “it’s likely a combination of all the improvement projects that we’ve done, things that you see goin’ on in the watershed, we’ve done some dredging, the city of Storm Lake has done some, uh, improvement, uh, projects, weather patterns and in lower rough fish numbers, and we can’t, uh, assign, like, one foot of clarity is from dredging, one foot of clarity is from our little Storm Lake project, likely, in any given year, they’re having a different effect, based on the weather and water levels and stuff, but that was the goal of doing all these works, that what we’ve invested so much in over these past fifteen to twenty years, it’s to improve water quality.”
From 2015 to 2016, water clarity in California’s Lake Tahoe decreased by 6%.
In 2015, Researchers from U.C. Davis said that a 6% decrease in water clarity in Lake Tahoe was caused by “Warmer water and lack of snow”.
We must recall that, just one year previously, in 2014, U.C. Davis researchers attributed the 10.2% year-over-year increase in the clarity of Lake Tahoe, which was the largest one-year increase in clarity in Lake Tahoe in history, to “the drought”.
From 2016 to 2017, egg production at the hatchery on Storm Lake, Iowa increased by 14%.
From 2016 to 2017, water clarity in California’s Lake Tahoe decreased by 12%.
In 2016, researchers from U.C. Davis attributed a 12% decrease in clarity in Lake Tahoe to “record snow and rain”
In July 2016, the water in New Jersey suddenly turned Caribbean blue for the first time in history.
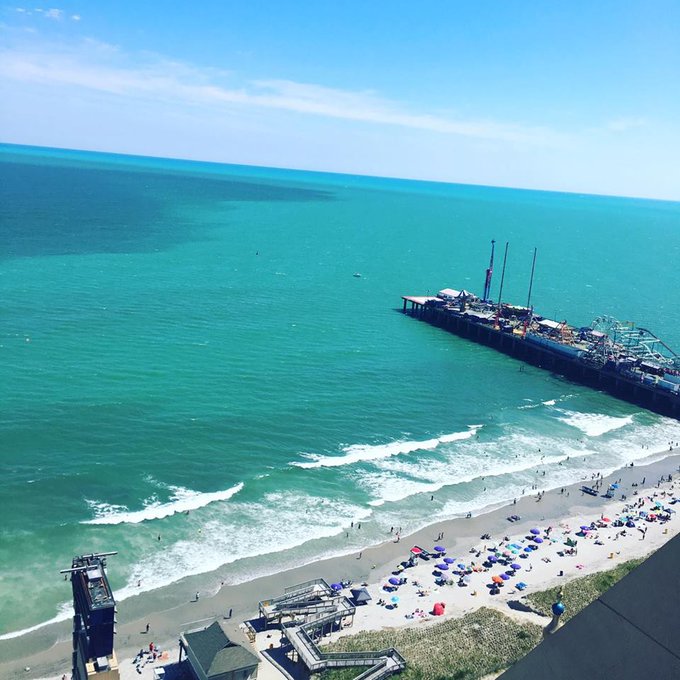
(Never before seen Caribbean blue water in New Jersey, July 2016)
From 2017 to 2018, water clarity in California’s Lake Tahoe increased by 14%, the largest one-year increase in history.
Capradio.org omitted the percentage, and said that Lake Tahoe’s water clarity “jumped 10 feet”.
In 2017, U.C. Davis researchers attributed the 14% increase in clarity in Lake Tahoe, the largest in the history of the Lake, to “end of drought”.
From 2018 to 2023, Lake Tahoe’s water clarity increased by 19%, from 60.4 feet to 71.7 feet.
In 2019, researchers from U.C. Davis said that a 17% increase in water clarity in Lake Tahoe was caused by “end of drought”.
Essay: Explain how record snow and rain in decreased water clarity in Lake Tahoe by 12% in 2016 and increased water clarity there by 17% in 2019.
Answer: The researchers from U.C. Davis are bloodline-linked generational Satanist Freemasons, all using conscious deception while retaining the firmness of purpose that goes with complete honesty.
In 2018, the water clarity increase in Minnesota’s Lake Winnibigoshish was said to be “rapid and astounding - more than doubling, from 6-7 feet to 14 feet and more now.” The clarity increase in Storm Lake was attributed to “zebra mussels”.
From 2018 to 2019, in the near-complete absence of native zooplankton, the 18% increase in Lake Tahoe’s water clarity was 1,700% greater than its purportedly plankton-driven 1% increase in clarity from 2021 to 2022.
The clarity of Lake Tahoe in California is increasing exponentially, going forward in time.
That’s because the health of the ether is inexorably increasing, and water quality and clarity vary directly with the health of the ether.
From 2018 to 2019, with its native zooplankton near a record low, water quality in Lake Tahoe increased by 18%, from 60.4 feet to 70.9 feet. It was the biggest one-year improvement since they began keeping records there 50 years ago.
Jesse Patterson, Chief Strategy Officer for the League to Save Lake Tahoe, said it was because of “fluctuating weather patterns”.
From 2019 to 2023, Lake Tahoe’s water clarity increased by 1.1%, from 70.9 feet to 71.7 feet. Sudeep Chandra, director of the Ozmen Institute for Global Studies and the Global Water Center and a professor at the University of Nevada, said it was because of “the drought of 2022”.
When, in fact, in the 2022-2023 California Rainfall Season, South Lake Tahoe was 184% above the long term average from 1991 to 2020.
I have exposed the duplicity of Sudeep Chandra, the Global Water Center and the University of Nevada by using what was known in the old days as “fact checking”.
As a bonus, Sudeep did not mention anything about native zooplankton.
While scientists with UC Davis’ Tahoe Environmental Research Center said the improved clarity was “due in part to a resurgence of the lake’s native zooplankton,” researchers said in the report. "They’ve provided a natural clean-up crew to help restore the lake’s famous blue waters.
In 2019, water quality in the Chesapeake Bay was the highest since record keeping began.
In 2019, Thailand’s Mekong River suddenly became clear.
From 2020 to 2023, the average clarity of Lakes Mendota, Monona, Waubesa, Wingra and Kegonsa in Wisconsin increased by 17.2%, from 87 centimeters to 102 centimeters.
From 2020 to 2023, the average clarity of Lakes Mendota, Monona, Waubesa, Wingra and Kegonsa in Wisconsin increased by an annual average of 5.7%.
From 2020 to 2021, the average clarity of Lakes Mendota, Monona, Waubesa, Wingra and Kegonsa in Wisconsin decreased by 1.1%, from 87 centimeters to 86 centimeters.
In 2020, the water in the canals of Venice suddenly became clear.
From 2021 to 2023, the 4.1% average annual increase in the health of the James River in Virginia was 144% greater, or well more than double its 1.68% average annual increase from 2007 to 2023.
The health of the James River in Virginia is increasing exponentially, going forward in time.
That’s because the health of the ether is inexorably increasing, and water quality and clary vary directly with the health of the ether.
From 2022 to 2023, water clarity in Michigan’s Silver Lake increased by 39.3%, from 2.8 feet to 3.9 feet.
Spring Lake, Michigan’s Restorative Lake Sciences said that it was because of “Biochar nutrient reductions from Biochar filters in the lake basin mounted on docks and boats, and the drains.”
The uncredited Intelligence operative from Restorative Lake Sciences did not mention that exponentially increasing water clarity and quality in Silver Lake in Michigan was part of a wider trend taking place regardless of geography.
That’s an example of the propaganda technique known as “compartmentalization”.
From 2021 to 2023, the health of the James River in Virginia increased by 8.2%, from 61 to 66.
The James River Association withheld the percentage of the increase from 2021 to 2023, and said only that the heath of the James River in Virginia “increased from a C+ to a B”, and that it was because of “protection and restoration efforts”.
From 2021 to 2023, the health of the James River increased by an annual average of 4.1%.
Wtkr.com’s Christinna Bautista made no mention of the fact that exponentially increasing water quality and clarity in the James River in Virginia was part of a wider trend taking place regardless of geography.
That’s an example of the propaganda technique known as “compartmentalization”.
From 2021 to 2023, underwater grasses in the James River in Virginia expanded to their highest total on record.
From 2021 to 2023, water quality in the James River in Virginia increased to the highest level on record.
In 2021, the 1.5 cubic mile average size of the Chesapeake Bay dead zone was 35% below its .97 cubic mile long-term average from 1985 to 2022.
Chesapeake Bay Program Communications Director Rachel Felver withheld the percentage, and described it only-generally as “average”.
In 2021, the Chesapeake Bay dead zone averaged 1.5 cubic miles.
From 2021 to 2022, the 57% decrease in the average size of the Chesapeake Bay dead zone was 1,627% greater than its 3.3% long-term annual average decrease from 1985 to 2023.
From 2021 to 2022, the average size of the Chesapeake Bay dead zone decreased by 57%, from 1.5 cubic miles to .65 cubic miles.
The Chesapeake Bay Foundation’s Director of Science and Agricultural Policy, Beth McGee said that it was due to “our pollution reduction efforts”.
Beth didn’t mention anything about the fact that water quality and clarity was increasing regardless of geography.
That’s an example of the propaganda technique known as “compartmentalization”.
From 2021 to 2022, water clarity in Calfornia’s Lake Tahoe increased by 32%, from 61 feet to 80.6 feet, to the highest level since the 1980’s. It was the largest one-year improvement in clarity in history. The Tahoe Environmental Research Center said it was because of “zooplankton”.
From 2021 to 2022, the 32% increase in water clarity in Lake Tahoe was 88% greater, or almost double its 17% increase in clarity from 2018 to 2019
In 2022, the Chesapeake Bay dead zone averaged .65 cubic miles.
In 2022, the .65 cubic-mile Chesapeake Bay dead zone 33% below its long-term average of .97 miles from 1985 to 2022.
The Chesapeake Bay Foundation’s Media and Communications Coordinator A.J. Metcalf withheld the percentage, and described it merely as “smaller than the historical average”.
The Chesapeake Bay Foundation’s Director of Science and Agricultural Policy, Beth McGee also omitted the percentage, described it merely as “below average”, and then walked it back further still to “average”, and then concluded “much of the bay is still off-limits for aquatic life”.
When, in fact, while cubic miles and square miles are not the same, .65 is .014% of the Chesapeake Bay’s 4,479 square miles of surface area.
I have exposed the duplicity of The Chesapeake Bay Foundation’s Director of Science and Agricultural Policy, Beth McGee by using what was known in the old days as “fact checking”.
In 2022, Lake Tahoe’s native zooplankton experienced an unquantified “resurgence”.
Scientists with UC Davis’ Tahoe Environmental Research Center did not provide any data on the phenomenon, and offered no explanation as to what might have caused it.
That’s an example of the propaganda technique known as “stonewalling”.
From 2022 to 2023, the 20% decrease in the average size of the Chesapeake Bay dead zone was 506% greater, or more than six times greater than its 3.3% long-term annual average decrease from 1985 to 2023.
The quality of the Chesapeake Bay is increasing exponentially, going forward in time.
That’s because the health of the ether is inexorably increasing, and water quality varies directly with the health of the ether.
From 2022 to 2023, the 11.1% average increase in the June to August clarity of Lake Wingra in Wisconsin was 404% greater, or over five times greater than its 2.2% long-term average annual increase in average June to August clarity from 2014 to 2023.
The clarity of Lake Wingra in Wisconsin is increasing exponentially in clarity, going forward in time.
That’s because the health of the ether is inexorably increasing, and water clarity varies directly with the health of the ether.
From 2022 to 2023, the 2.4% average increase in the June to August clarity of Lake Mendota in Wisconsin was 366% greater or well more than four times greater than its .9% long-term average annual decrease in average June to August clarity from 2014 to 2023.
The clarity of Lake Mendota in Wisconsin is increasing exponentially in clarity, going forward in time.
That’s because the health of the ether is inexorably increasing, and water clarity varies directly with the health of the ether.
From 2022 to 2023, the 14.3% average increase in the June to August clarity of Lake Kegonsa in Wisconsin was 113% greater, or well more than double its 6.7% long-term average annual increase in average June to August clarity from 2014 to 2023.
The clarity of Lake Kegonsa in Wisconsin is increasing exponentially in clarity, going forward in time.
That’s because the health of the ether is inexorably increasing, and water clarity varies directly with the health of the ether.
From 2022 to 2023, the 3.9% average increase in the June to August clarity of Lake Monona in Wisconsin was 50% greater than its 2.6% long-term average annual increase in average June to August clarity from 2014 to 2023.
The clarity of Lake Monona in Wisconsin is increasing exponentially in clarity, going forward in time.
That’s because the health of the ether is inexorably increasing, and water clarity varies directly with the health of the ether.
From 2022 to 2023, the average June to August clarity of Lake Waubesa in Wisconsin increased by 24%, from 83 centimeters to 103 centimeters.
From 2022 to 2023, the average size of the Chesapeake Bay dead zone decreased by 20%, from .65 cubic miles to .52 cubic miles.
From 2022 to 2023, the average June to August clarity of Lake Kegonsa in Wisconsin increased by 14.3%, from 84 centimeters to 96 centimeters.
From 2022 to 2023, the average June to August clarity of Lake Wingra in Wisconsin increased by 11.1%, from 108 centimeters to 120 centimeters, the highest clarity level possible.
From 2022 to 2023, the average clarity of Lakes Mendota, Monona, Waubesa, Wingra and Kegonsa in Wisconsin increased by 7.4%, from 95 centimeters to 102 centimeters.
The uncredited Intelligence operative from the State propaganda organ known as clearlakealliance.org walked the highest water clarity in the history of the lakes back to merely “good”, and said that it had been caused by “low spring and summer rainfall volume and intensity”.
From 2022 to 2023, the average June to August clarity of Lake Monona in Wisconsin increased by 3.9%, from 103 centimeters to 107 centimeters.
From 2022 to 2023, the average June to August clarity of Lake Mendota in Wisconsin increased by 2.4%, 84 centimeters to 86 centimeters.
In November 2022, the Chesapeake Bay Foundation’s Media and Communications Coordinator A.J. Metcalf downgraded the average size of the Chesapeake Bay dead zone by 19%, from an actual .97 cubic miles to a fraudulent .79 cubic miles.
I have exposed the duplicity of A.J. Metcalf and the Chesapeake Bay Foundation by using what was known in the old days as “fact checking”.
In 2023, the James River Association described the health of the James river as “good”, and graded the health of the river as a “B+”, or 66.
When, in fact, in 2023, the water quality of the James River was the highest in history, and the underwater grasses in the river expanded to the largest area on record.
I have exposed the duplicity of the James River Association by using what was known in the old days as “fact checking”.
In 2023, the Chesapeake Bay dead zone averaged .52 cubic miles, the lowest since record keeping began in 1985.
Marjy Friedrichs, professor at William & Mary’s Virginia Institute of Marine Science said of the lowest levels of hypoxia in history "The low levels of hypoxia in 2023, despite the high temperatures, are truly surprising.”
In 2023, the .52 cubic-mile Chesapeake Bay dead zone was 46% below its long-term average of .97 miles from 1985 to 2022.
Marjy Friedrichs, professor at William & Mary’s Virginia Institute of Marine Science, said that it was because of "our nutrient reduction strategies.
In the summer of 2023, according to monolake.org, Mono Lake in California was “appeared noticeably clearer than it has during most summers over the last decade.”
Monolake.org’s Field Technician, named only as “Robbie”, went on to say “Anecdotally, 2023 appears to have even greater clarity than 2017, but data are still being collected and processed.”
That’s an example of the propaganda technique known as “slow-playing” or “stonewalling”.
In regard to why Mono Lake’s clarity increased suddenly and exponentially in 2023, monolake.org’s Field Technician “Robbie” said that it was a “mystery”.
“Robbie” made no mention of the fact that exponentially increasing water quality and clarity in Mono Lake in California was part of a wider trend taking place regardless of geography.
That’s an example of the propaganda technique known as “compartmentalization”.
THE ARTICLES
In February 2016, the Chicago Tribune published what is in the Intelligence trade referred to as a “hit piece”, headlined “Federal budget cuts could slow Lake Michigan restoration projects”.
Since sixty to seventy percent of readers only read the headlines, it effectively “compartmentalizes” the message that is delivered by this photograph in the article below:
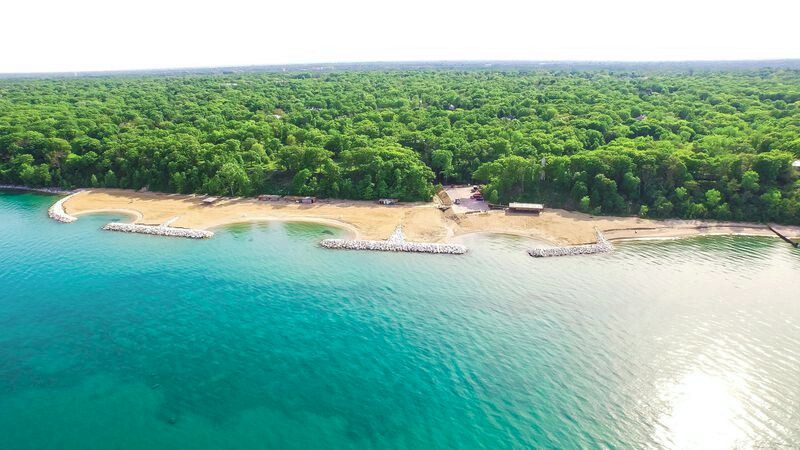
(Aerial view of Rosewood Beach, Highland Park, Michigan, 2016)
The caption of the photo reads: “An aerial view of Rosewood Beach in Highland Park, Michigan, which was restored through funds from the Great Lakes Restoration Inititative.”
Where the “restoration initiative” is real, and had actual funds, which were spent on actual activity - but it was merely incremental in impact, not quantum, as alleged. It’s a local plausible-deniability excuse, put forward to keep your eyes off the larger trend I’m elucidating here. What did they do, rake the beach? Send out divers to pick up cans and tires? I know that no gigantic water-filtration equipment was in place at the site, or we’d have been shown a picture of it. It’s mostly pure bullshit - what they refer to in the intelligence trade as a “limited hangout.”
There’s no mention of the fact that water clarity is improving regardless of geography, which is an example of the propaganda technique known as “compartmentalization”.
On July 13, 2016, the News-Press said “Turquoise-blue water appears…in New Jersey”.
The article goes on to say:
“According to this detailed article from The Press of Atlantic City, the combination of a phytoplankton bloom and a drought across much of the Northeast has caused the waters of the southern Jersey Shore to look more tropical than at any time in recent memory. The phenomenon has been going on for 10 days, and will continue for as long as wind patterns allow it.”
Here’s a picture from the article:
(Never seen in history, Caribbean blue water in New Jersey, 2016)
In July 2016, the water in New Jersey suddenly turned Caribbean blue for the first time in history.
In 2017, the Detroit News said Lake Huron and Lake Michigan saw an “increase” in water clarity.
In October 2017, in an amazing example of a Satanic Inversion, Pys.org said that clear lakes “disguise impaired water quality.” Assimilating it involves an example of what George Orwell called “Doublethink”.
The words “mystery”, “baffled” and “puzzled” are memes, used, among numerous similar variants, whenever anyone in the wholly-controlled-and-coopted Political, Academic, Scientific and Media establishments wants to lie about, well, basically anything. One of those variants is “amazed”.
That’s why an article from Iowa’s Storm Lake Pilot Tribune from June 2018 is headlined “DNR ‘amazed’ by lake’s water clarity improvement”.
Where “improvement” is general. The international news blackout that is in place on this subject forbids the use of statistics that would provide specific insight into the magnitude of the trend I’m documenting here.
Since sixty to seventy percent of readers only read the headlines, it goes a long way toward “compartmentalizing” the phenomenon.
The article continues: “Things are looking good in the lake, thanks in part to a $50,000 donation from the Lake Preservation Association and regulation over recent years, said George Antoniou, coordinator for the Lake Restoration Program with the Iowa Department of Natural Resources.”
Where a lake that is looking great has been hedged back to looking merely “good”. And where the bullshit plausible-deniability excuses of “fifty grand” and the only-general “regulation” are put forward because the propagandist knows that many or most readers will grasp virtually any straw, no matter how thin, to remain off the hook of personal responsibility.
The article goes on to say “The Storm Lake hatchery has had an “absolutely stellar year,” Wallace said. It was second-best in the hatchery’s 32-year history with a harvest of nearly 500 quarts of eggs. “What this tells us is that the methods we’ve imposed on this lake of releasing fish 17 to 22 inches long is working, and that it takes time to see the effects of regulation and changes,” he said.
Can you see how he’s pretending that they managed to do it, themselves, and doesn’t mention record hatches taking place at other fish hatcheries in other geographies? That’s an example of the propaganda technique known as “compartmentalization”.
The article continues: “This year, 16 million fry were released into the lake, up from the usual 14, due to the surplus. Storm Lake is one of four lakes in the state that collects eggs.”
With a straight face, the propagandist has just said, to you face “the surplus in eggs is due to the surplus in eggs”. I’m sure you noticed that they provided the numbers, but carefully hedged by withholding the far more impactful percentage increase between them. That’s another example of the propaganda technique known as “compartmentalization”. So, I had to do the math. It’s a 14% increase, in one year.
The words “mystery”, “baffled” and “puzzled” are memes, used, among numerous similar variants, whenever anyone in the wholly-controlled-and-coopted Political, Academic, Scientific and Media establishments wants to lie about, well, basically anything. One of those variants is “amazed”. That’s why the article goes on to say “I have been amazed by the water clarity this year,” Wallace said. Antoniou echoed that sentiment, saying that water will continue to be monitored three times per year by Iowa State University to continue the good trends. He attributed the improvements in the lake to strong local leadership and support from the community.”
Where “strong local leadership” and “support from the community” are both only-general bullshit plausible-deniability excuses put forward because the propagandist knows that many or most readers will grasp virtually any straw, no matter how thin, to remain off the hook of personal responsibility.
Here’s George’s picture:

(George Antonio, Iowa DNR)
I’ve included his photograph so you could get a better idea of what a generational Satanist in a position of marginal influence looks like.
By the way, Storm Lake is a thinly-veiled reference to the storm god the folks in charge have worshipped under various guises all the way back to Babylon, and before.
In 2019, water quality in the Chesapeake Bay was the highest since record keeping began.
We get the name Satan from Set, also known as Seth and Suetekh, who was the Egyptian god of war, chaos and storms, brother of Osiris, Isis, and Horus the Elder, uncle to Horus the Younger, and brother-husband to Nephthys.

(The repugnant god Set, the repugnant Jar Jar Binks, and the repugnant god Set)
In August 2012, it was said that water clarity in Lake Tahoe “improved”, “despite extreme weather.” In March 2013, it was said that Lake Tahoe’s water quality was “improving”. In 2015, Phys.org said that water clarity levels in Lake Tahoe “improved” in 2014, “the biggest improvements in more than a decade.”
Well, if that’s true, why did a U.C. Davis report in May 2017 say that “Climate change” was “harming” Lake Tahoe’s clarity?
It’s not true. The University of California at Davis is a Trusted Authority Figure, using conscious deception with the firmness of purpose that goes with complete honesty.
Water quality in Lake Tahoe increased 17% from 2018 to 2019, to the highest level in history. It was the biggest one-year improvement since they began keeping records 50 years ago.
The words “mystery”, “baffled” and “puzzled” are memes, used, among numerous similar variants, whenever anyone in the wholly-controlled-and-coopted Political, Academic, Scientific and Media establishments wants to lie about, well, basically anything. One of those variants is “stunning”. That’s why a Mercury News article from May 2019 is headlined “Lake Tahoe shows stunning improvement in water clarity over past year”.
Where “stunning”, while lurid, is general. The international news blackout that is in place on this subject forbids the use of statistics that would provide specific insight into the magnitude of the trend I’m documenting here.
Since sixty to seventy percent of readers only read the headlines, it goes a long way toward “compartmentalizing” the phenomenon.
(Lake Tahoe, 2019)
I had to read the article, and then do the math to learn that water quality in Lake Tahoe increased 17% from 2018 to 2019, to the highest level in history. It was the biggest one-year improvement since they began keeping records 50 years ago.
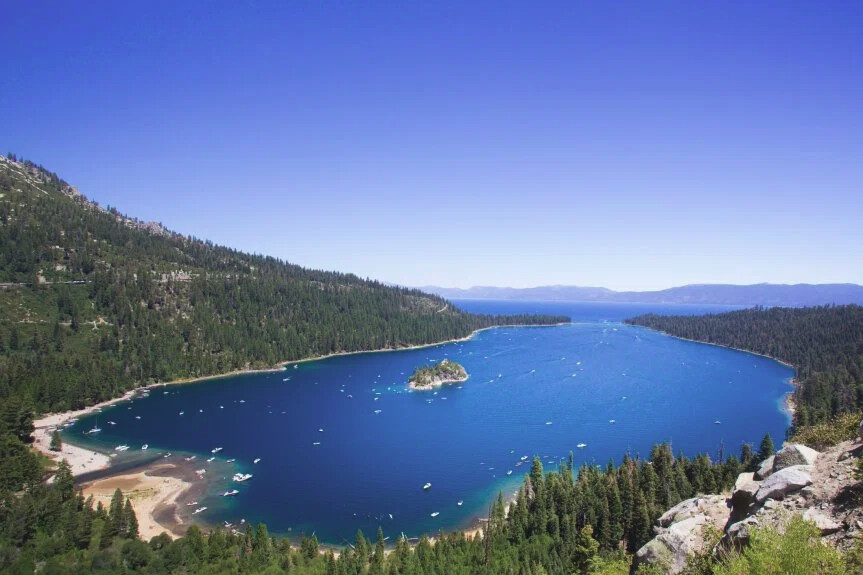
(Lake Tahoe, 2019)
In May 2019, a Minnesota Public Radio article said “Study: Improving water clarity in Mille Lacs means less habitat for walleye”.
The author attributed the only-generally-described “improving” water quality in the lake to “septic system improvements around the lake and the invasion of zebra mussels, which are filter feeders that strain out microscopic algae.”
Where the only-generally-described “septic system IMPROVEMENTS” and “the invasion of zebra mussels” are bullshit plausible-deniability excuses, put forward at the local level to keep your eye off the wider trend of increasing water clarity that I’m documenting here.
The author put “STUDY:” on the front end of the headline to give the subconscious of the reader the green light to say “oh, but that was just one study!” The propagandist knows that many or most readers will grasp virtually any straw, no matter how thin, to remain off the hook of personal responsibility.
Gretchen Hansen, an assistant professor at the University of Minnesota and the study’s lead author said “As the water has gotten clearer, more light can penetrate into the water,” she said. “And walleye, being low-light specialists, don’t really like that.”
In 1991, Zebra mussels invaded Saginaw Bay in Michigan. In May 2018, the Times Herald said “Anglers hook record numbers of walleye on Saginaw Bay”.
Where “RECORD numbers” is general. The international news blackout that is in place on this subject forbids the use of statistics that would provide specific insight into the magnitude of the trend I’m documenting here. Since sixty to seventy percent of readers only read the headlines, it goes a long way toward “compartmentalizing” the phenomenon.
You have to read the article to learn “Anglers took 123793 walleye, the most measured since creel surveys began on Saginaw Bay in 1983.”
Thus, Zebra-mussel-infested Saginaw Bay has the highest walleye numbers in history, refuting Ms. Hansen’s Middle-Ages, Punch-and-Judy thesis. I’ve exposed the duplicity of both the University of Minnesota and and Minnesota Public Radio using what was known in the old days as “fact-checking”.
Neither the study’s lead author or MPR mentioned that increasing water quality in Minnesota was part of a wider trend taking place regardless of geography. That’s an example of a propaganda technique known as “compartmentalization”.
Here’s Gretchen’s picture, where the image is constructed to focus attention on her left eye:

(Gretchen Hansen, Assistant Professor, Department of Fisheries, Wildlife and Confirmation Biology, University of Minnesota)
The image features her left eye because, to generational Satanist Freemasons like Gretchen, the left eye is the “eye of Will” or the “eye of Horus”.
But don’t take my word for it:
‘The right eye is the Eye of Ra and the left is the Eye of Horus’.”
From “Freemasonry - Religion And Belief - The 3rd Temple”
Facebook: “Welcome to the Left-Hand-Path-Network, where Satanism is not about worship, but it’s study.”
I have included Gretchen’s picture so that you could get a better idea of what a generational Satanist Freemason in a position of marginal influence looks like.
She figured that the rubes would never notice the coded visual imagery.
They are all related to one another through the maternal bloodline. They comprise between twenty and thirty percent of the populace, and are hiding in plain sight in every city, town and village on Earth.
It’s how the few have controlled the many all the way back to Babylon, and before.
But they say that the hardest part of solving a problem is recognizing that you have one.
Don Croft used to say “Parasites fear exposure above all else”.
Not all Fisheries professors are generational Satanists, of course. But all of those quoted in mainstream news publications certainly are.
You can’t recognize them by their appearance, beyond their almost-continuous use of supposedly “secret” hand signs.

You can only recognize them by the codified, highly-repetitive way in which they speak, and write.
They’re hiding in plain sight in every city, town and village on Earth, figuring the rubes would never notice.
You know them only-generally as “the One Percent”. They are the distinct and separate race that we know as “Neanderthal”. They’re all genetically related to one another. It’s a bloodline thing. As any middle schooler knows:
August 5, 2012 - 12 Year Old Girl Discovers All US Presidents Are Related to King John of England
They’re related through the maternal bloodline.
Here’s what you’re supposed to think a Neanderthal looks like:

(‘So easy, a caveman can do it’ advertisement, where the red-haired Neanderthal is off center to the left to focus attention his left eye)
While this is what a Neanderthal actually looks like:

(Red-haired, blue-eyed King John I of England, the guy all the US Presidents are related to through their maternal bloodlines, where the images is constructed to focus attention his left eye)
Apr 17, 2001 — Research leader Dr Rosalind Harding said: ‘It is certainly possible that red hair comes from the Neanderthals.’
2020 - “ScotlandsDNA believes that everyone who carries one of 3 variants of the red-hair gene is a direct descendant of the first redhead ever to have it”
January 31, 2008 - Blue-eyed humans have a single, common ancestor
It’s how the few have controlled the many, well, all the way back to Babylon, and before.
It’s why the ruling bloodlines of all the nations have the lightest skin.
We’re obviously going to have to recognize and come to terms with this if we’re going to make progress as a species. But they say that the hardest part of a problem is realizing that you have one.
The words “mystery”, “baffled” and “puzzled” are memes, used, among numerous similar variants, whenever anyone in the wholly-controlled-and-coopted Political, Academic, Scientific and Media establishments wants to lie about, well, basically anything. One of those variants is “significant”. That’s why a New Zealand Herald article from June 2019 is headlined “Study shows ‘significant’ improvement of lake water clarity around Rotorua.”
Where “significant” while accurate, is only-general. The international news blackout that is in place on this subject forbids the use of statistics that would provide specific insight into the magnitude of the trend I’m documenting here.
Since sixty to seventy percent of readers only read the headlines, it goes a long way toward “compartmentalizing” the phenomenon.
The author put “STUDY shows” on the front end of the headline to give the subconscious of the reader the green light to say “oh, but that was just one study!” The propagandist knows that many or most reader will grasp any straw, no matter how thin, to remain off the hook of personal responsibility.
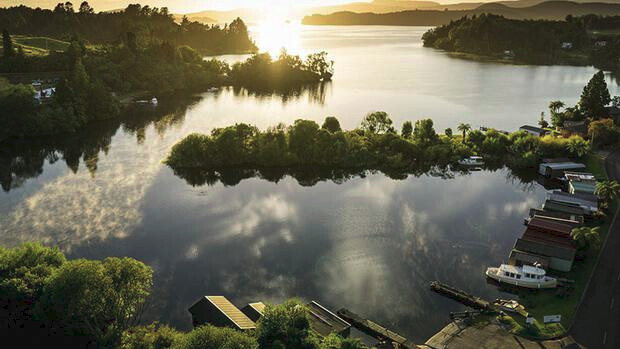
(Lake Rotorua, New Zealand, 2019)
The article continues: “A team led by senior scientist Dr Moritz Lehmann at Xerra Earth Observation Institute and the University of Waikato has published an analysis of trends in water clarity in 23 Rotorua lakes from 1999 to 2017. ‘We found that water clarity significantly improved in nine lakes over the 18-year study period,’ Lehmann said.
Where the Trusted Authority Figure parrots the same general hedge of “SIGNIFICANTLY” improved to blunt any insight into the magnitude of the trend I’m documenting here. The article contains no specific data as to what the improvements were, or when they occurred. As you may recall, generality is a hallmark of propaganda. They claim to be Scientists, but are deliberately keeping it completely general to keep your eye off the specific positive changes I’ve been documenting since they began in 2012/2013.
They’re also trying to spin it as if it’s been long, and slow and steady, over two decades, when in fact it has changed exponentially in just the last few years.
The article continues: “The researchers said some improvements could have resulted from lake management changes, such as alum dosing, water diversion and weed harvesting, but direct cause-and-effect relationships were not tested in this study.”
Where “alum dosing”, “water diversion” and “weed harvesting” are all general plausible-deniability excuses, put forward here at the local level to take your eye away from the wider trend of increasing water clarity that I’m documenting here. The propagandist knows that many or most reader will grasp any straw, no matter how thin, to remain off the hook of personal responsibility.
The article concludes: “Lehmann said other research work was exploring the reasons behind this.”
Where “OTHER research WORK” is, once again, general. There’s no mention of increasing water clarity in New Zealand being part of a wider trend. That’s an example of the propaganda technique known as “compartmentalization”.
In August 2019, the Texas Water Resources Institute said “East Texas watershed efforts to improve water quality seeing positive results”.
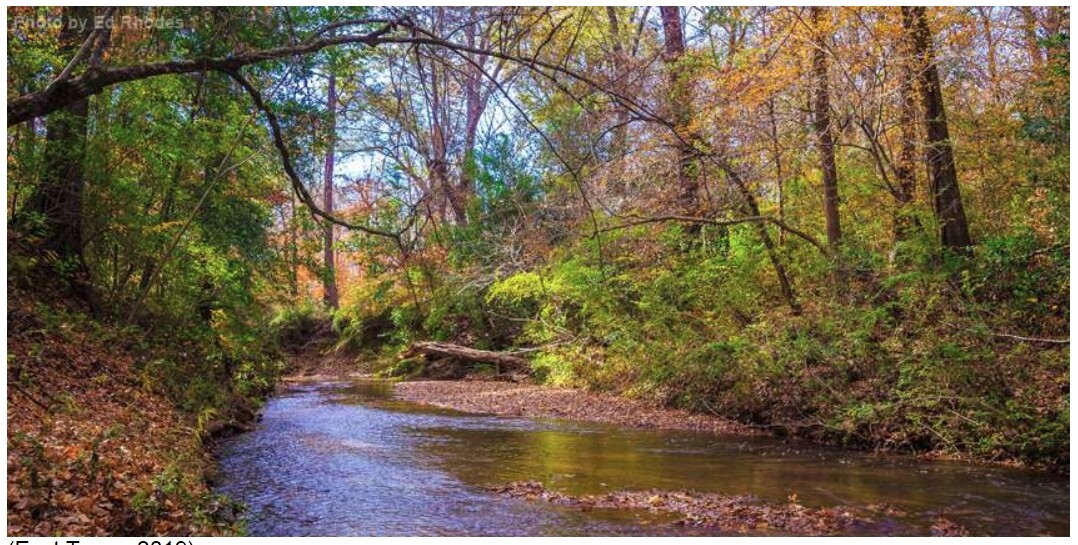
(East Texas, 2019)
East Texas, where, once again, an incremental, local campaign is claimed to have made the quantum change happen. No mention is made in the article of increasing water clarity in other locations, other geographies. That’s a propaganda technique called “compartmentalization.”
The article continues: “Anna Gitter, a Texas Water Resource Institute research associate, said the predominant water quality impairment in these other East Texas watersheds, as in the Attoyac Bayou, is bacteria.”
We’re back in Idiocracy once again, where bacteria decreases water clarity. Anna bravely advances the ludicrous plausible-deniability excuse because she knows that many or most readers will grasp virtually any straw, no matter how thin, to remain off the hook of personal responsibility.
But, remember, propaganda has a lifespan. And the positive changes the propaganda is rebutting aren’t stopping, but are, rather, increasing in speed and magnitude.
Here’s Anna’s picture:

(Anna Gitter, Associate, Texas Water Institute, wearing a natty Satanic-purple jacket, and where the image is constructed to focus attention on her left eye)
The image features her left eye because, to generational Satanist Freemasons like Anna, the left eye is the “eye of Will” or the “eye of Horus”.
But don’t take my word for it:
‘The right eye is the Eye of Ra and the left is the Eye of Horus’.”
From “Freemasonry - Religion And Belief - The 3rd Temple”
Facebook: “Welcome to the Left-Hand-Path-Network, where Satanism is not about worship, but it’s study.”
I have included Anna’s picture so that you could get a better idea of what a generational Satanist Freemason in a position of marginal influence looks like.
She figured that the rubes would never notice the coded visual imagery.
They are all related to one another through the maternal bloodline. They comprise between twenty and thirty percent of the populace, and are hiding in plain sight in every city, town and village on Earth.
It’s how the few have controlled the many all the way back to Babylon, and before.
But they say that the hardest part of solving a problem is recognizing that you have one.
Don Croft used to say “Parasites fear exposure above all else”.
Not all water researchers are generational Satanists, of course. But those who get quoted in mainstream news publications certainly are.
In December 2019, voanews.com said “Mekong River’s new aquamarine color may be sign of trouble”.
That’s an example of what I’ve dubbed a Satanic Inversion, and which George Orwell called, variously, “Doublespeak” and “Doublethink”.
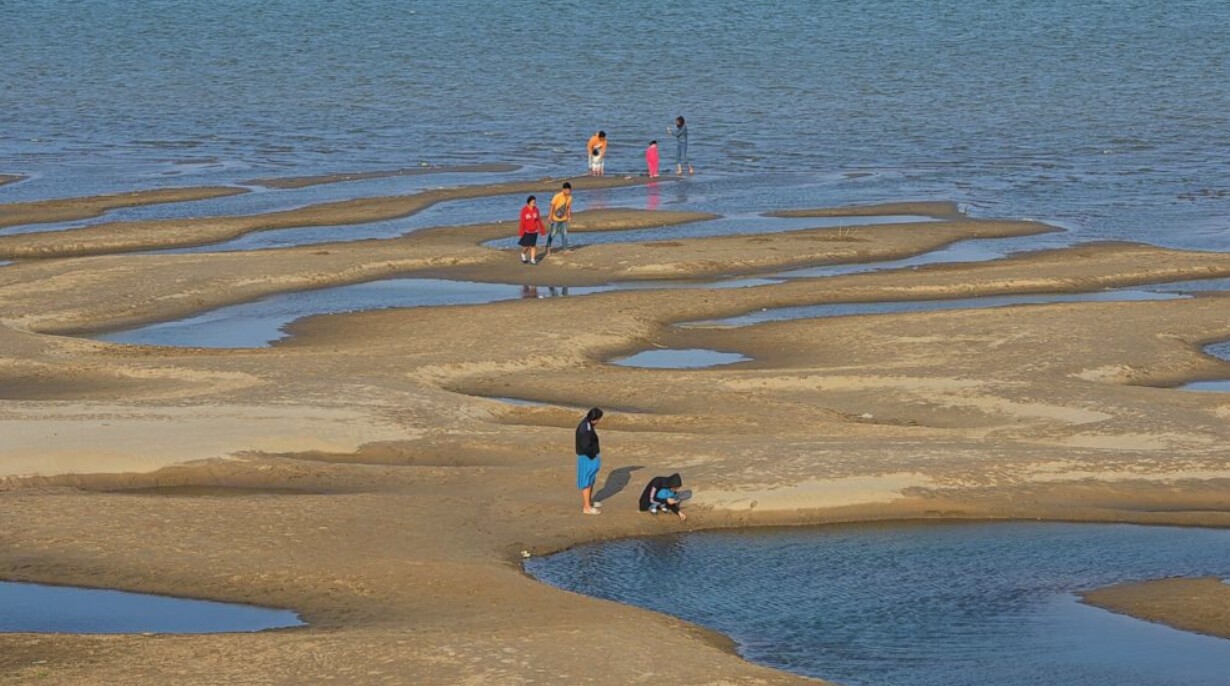
(Artificially-lowered but strikingly-blue Mekong river, Thailand, December 2019)
The article goes on to say “experts say the decline in sediment exposes a different danger that can result in greater erosion of the river’s banks and bed”. Which is another brazen Satanic Inversion. Rivers with high amounts of particulate matter in them eat away at river banks more assiduously than those with less. It’s like removing the abrasive from a polish. Can you see how “experts” is general?
The propagandist at VOA News has put forward this ridiculous plausible-deniability excuse because they know that many or most readers will grasp virtually any straw to remain off the hook of personal responsibility.
The author continues: “The experts and people living along the river blame a large hydroelectric dam upstream in Laos that began operating in October for contributing to both problems, though rainfall has also been sparse. Thailand’s rainfall increased 13% from 2019 to 2020, and was the second-highest total in history, second only to 1961.
The author bravely continues: “The dam blocks much sediment from moving further downstream, which accounts for the water becoming clear, said Pravit Kanthaduang, chief of the fishery office at Bueng Khong Long, a district in Thailand’s Bueng Kan province. Less sediment means less nutrition for plants and fish in the river, threatening the ecological balance, he said.”
Since we live in the Middle Ages, most readers have no trouble assimilating that fish eat river sediment.

(‘But Brawndo’s got what plants crave. It’s got electrolytes’)
There’s no mention in the article of the fact that water clarity is increasing regardless of geography, as documented in this article. That’s an example of the propaganda technique known as “compartmentalization”.
Since we live in the Middle Ages, most readers have no trouble assimilating that fish eat river sediment.
In March 2020, CNN said “Venice’s canal water looks clearer as coronavirus keeps visitors away”.
Here’s a picture from the article:
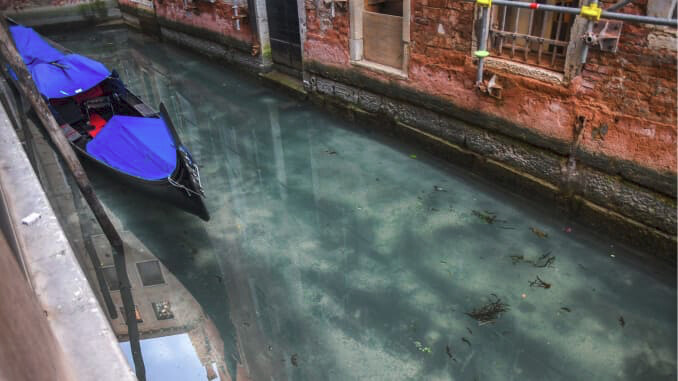
(Suddenly-clear canals in Venice, Italy, 2020)
Numerous “the dog ate it!” ruses are currently in play posturing that the engineered virus recently released upon the populace is responsible for all manner of things, including the collapsing smart phone industry, and the collapsing electric car industry, to name only two of many others. As you can see from the headline up above from Venice, Italy, it’s also claimed to be responsible for increasing the water clarity, there.
Well, in this case, it’s not the virus, per se. It is being claimed that the recent virus-related lack of activity on Venice’s canals has caused sediment levels in them to drop, clarifying the water. That’s, well, plausible. And it is, in fact, a half-truth. And half-truths are the engine of propaganda.
The decrease in activity and related drop in churned-up sediment are real, but are merely incremental in impact, rather than quantum, as alleged. It’s a local plausible-deniability excuse, put forward to keep your eyes off the larger trend I’m elucidating here.
I thought it would be helpful if I reprised several of my pre-virus “increasing water clarity” articles below, to forestall the propaganda.
I pulled all of the pictures up into a bunch for you:
I would add that, while gondolas are moved with poles, rotation creates Death energy, and that the removal of X number of rotating propellers from the waters in an around Venice during this period of relative inactivity may be a factor in the improvement in the water quality. I mean, think about it - who is impacting the sedimentary bottom of the water system of Venice in any major way? There are gondolas, and their operators put poles down to the bottom and move their gondola’s forward. But they’d done so for many, many hundreds of years, and “gondola-related sediment” is simply not ringing true to me.
But a view of the pre-virus-inactivity water clarity photos below “settles” the matter, at least for me. Proves that a drop in tourist-traffic related sediment is not the primary driver of the improvement in water clarity there.
The words “mystery”, “baffled” and “puzzled” are memes, used, among numerous similar variants when anyone in the wholly-controlled-and-coopted Political, Academic, Scientific and Media establishments wants to lie about, well, basically anything. One of those many variants is “perplexed”.
That’s why an sfgate.com article by Julie Brown from July 14, 2022 said “Lake Tahoe’s clarity hasn’t changed in decades, and it’s ‘perplexing’ scientists”.
When, in fact, Lake Tahoe’s water clarity increased by 17.9% from 2018 to 2019.
I have exposed the duplicity of Julie Brown and sfgate.com by using what was known in the old days as “fact checking”.
Here’s Julie Brown’s picture, where the image is constructed to focus attention on her left eye:

(SFgate.com’s Julie Brown, who said “Lake Tahoe’s clarity hasn’t changed in decades, and it’s ‘perplexing’ scientists”. When, in fact, Lake Tahoe’s water clarity increased by 18% from 2018 to 2019. I have exposed her duplicity by using what was known in the old days as “fact checking”.)
The image features her left eye because, to generational Satanist Freemasons like Julie, the left eye is the “eye of Will” or the “eye of Horus”.
But don’t take my word for it:
‘The right eye is the Eye of Ra and the left is the Eye of Horus’.”
From “Freemasonry - Religion And Belief - The 3rd Temple”
Facebook: “Welcome to the Left-Hand-Path-Network, where Satanism is not about worship, but it’s study.”
I have included Julie’s picture so that you could get a better idea of what a generational Satanist Freemason in a position of marginal influence looks like.
She figured that the rubes would never notice the coded visual imagery.
They are all related to one another through the maternal bloodline. They comprise between twenty and thirty percent of the populace, and are hiding in plain sight in every city, town and village on Earth.
It’s how the few have controlled the many all the way back to Babylon, and before.
But they say that the hardest part of solving a problem is recognizing that you have one.
Don Croft used to say “Parasites fear exposure above all else”.
SEPTEMBER 2021
On September 17, 2021, news.maryland.gov said “The hypoxic water volume — areas with less than 2 mg/l oxygen — was 1.88 and 1.61 cubic miles during early and late August monitoring cruises, compared to historical early and late August averages (1985-2020) of 1.35 and 1.06 cubic miles.”
Can you see how the Science Feds in Maryland cut the data up into four pieces, so that nobody on Earth would ever do the math? Well, I did the math.
In 2021, the Chesapeake Bay dead zone averaged 1.5 cubic miles.
On December 13, 2021, usgs.gov said “Experts Find an Average Chesapeake Bay Dead Zone in 2021”.
Where Chesapeake Bay Program Communications Director Rachel Felver said “Experts Find an Average Chesapeake Bay Dead Zone in 2021” because it’s general.
As a propagandist, Rachel knows that, since seventy percent of readers only read the headlines, her hedging generality goes a long way toward blunting awareness of the scope of the sudden, exponential decrease in the size of the Chesapeake Bay dead zone which she is attempting to obfuscate.
There’s no mention of any motion or trend in this headline.
Spectacularly, Rachel’s article doesn’t mention anything about the specific size of the Chesapeake Bay dead zone in 2021. So I’m going to have to look up another article.
Here’s Rachel Felver’s picture, where she’s slightly off-center to the left, to accentuate her left eye:

(Chesapeake Bay Program Communications Director Rachel Felver, who described a Chesapeake Bay dead zone 33% below average as “average”.)
The picture features her left eye because, to generational Satanist Freemasons like Rachel, the left eye is the “eye of Will” or the “eye of Horus”.
But don’t take my word for it:
‘The right eye is the Eye of Ra and the left is the Eye of Horus’.”
From “Freemasonry - Religion And Belief - The 3rd Temple”
Facebook: “Welcome to the Left-Hand-Path-Network, where Satanism is not about worship, but it’s study.”
I have included Rachel’s picture so that you could get a better idea of what a generational Satanist Freemason in a position of marginal influence looks like.
She figured that the rubes would never notice the coded visual imagery.
Generational Satanists are all related to one another through the maternal bloodline. They comprise between twenty and thirty percent of the populace, and are hiding in plain sight in every city, town and village on Earth.
It’s how the few have controlled the many all the way back to Babylon, and before.
But they say that the hardest part of solving a problem is recognizing that you have one.
Don Croft used to say “Parasites fear exposure above all else”.
On November 17, 2022, cbf.org said “CBF Statement on 2022 Chesapeake Bay Dead Zone Survey Results”.
Where the Chesapeake Bay Foundation’s Media and Communications Coordinator A.J. Metcalf said "CBF Statement on 2022 Chesapeake Bay Dead Zone Survey Results" because it’s general.
As a propagandist, A.J. knows that, since seventy percent of readers only read the headlines, his hedging generality goes a long way toward blunting awareness of the scope of the sudden, exponential decrease in the size of the Chesapeake Bay dead zone which he is attempting to obfuscate.
The article goes on to say “The Chesapeake Bay Foundation (CBF) is encouraged by new survey results released Wednesday by the Maryland Department of Natural Resources and Old Dominion University that found the area of low dissolved oxygen in the Bay was better than average for 2022.”
Here, A.J. has once again used the generalities “results” and “better”, while basically restating the headline, which is a violent command to the subconscious of the Coincidence theorist reader to stop reading immediately.
The article goes on to say “this area in the Bay’s mainstem is referred to as the dead zone because it is inhospitable to marine life such as oysters, striped bass, and blue crabs. According to the survey results, in 2022 the size of the dead zone averaged about 0.65 cubic miles, smaller than the historical average of 0.79 cubic miles, making it the 10th smallest recorded dead zone in the survey’s 38-year history.”
Wait, .79 miles, what? I fact-checked that, and a current article on chesapeakebay.net says “The average dead zone size is . 97 cubic miles”.
In November 2022, the Chesapeake Bay Foundation’s A.J. Metcalf downgraded the average size of the Chesapeake Bay dead zone by 19%, from an actual .97 cubic miles to a fraudulent .79 cubic miles.
I have exposed his duplicity by using what was known in the old days as “fact checking”.
Did you notice how, yet again, the general “smaller” was used to obfuscate the specific size of the decrease in the dead zone area?
That’s an example of the propaganda technique known as “compartmentalization”.
So, I had to do the math.
In 2022, the Chesapeake Bay dead zone averaged .65 cubic miles, which was 17.7% less than the long-term average of .79 miles from 1985 to 2022.
The article goes on to say "In response to the dead zone survey results, CBF’s Director of Science and Agricultural Policy Beth McGee issued the following statement:
“This year’s results showing a ‘better than average’ dead zone is, in part, a reflection that our pollution reduction efforts are working. Unfortunately, ‘average’ or ‘better than average’ isn’t acceptable as it means much of the Bay is still off-limits for aquatic life."
For those keeping score, the Chesapeake Bay has a surface area of 4,479 square miles, and, while cubic miles cannot be converted to square miles, or vice versa, I’ll note that .65 is .014% of 4,479, which makes the Chesapeake Bay Foundation’s Director of Science and Agricultural Policy, Beth McGee’s statement that the 10th-smallest dead zone in the history of the Chesapeake meant that “much of the bay is still off-limits for aquatic life” a fantastic, bald-faced lie.
Did you notice how, with a straight face, Beth described 2022’s 33% below average as “below average”, and then walked it back to “average”?
Here’s A.J. Metcalf’s picture, where he’s slightly off-center to the left, to accentuate his left eye:

(The Chesapeake Bay Foundation’s Media and Communications Coordinator A.J. Metcalf, who downgraded the average size of the Chesapeake Bay dead zone by 19%, from an actual .97 cubic miles to a fraudulent .79 cubic miles., and who called a dead zone 33% below average “better than average”, while withholding the percentage.)
The picture features his left eye because, to generational Satanist Freemasons like A.J., the left eye is the “eye of Will” or the “eye of Horus”.
But don’t take my word for it:
‘The right eye is the Eye of Ra and the left is the Eye of Horus’.”
From “Freemasonry - Religion And Belief - The 3rd Temple”
Facebook: “Welcome to the Left-Hand-Path-Network, where Satanism is not about worship, but it’s study.”
I have included A.J.’s picture so that you could get a better idea of what a generational Satanist Freemason in a position of marginal influence looks like.
He figured that the rubes would never notice the coded visual imagery.
Generational Satanists are all related to one another through the maternal bloodline. They comprise between twenty and thirty percent of the populace, and are hiding in plain sight in every city, town and village on Earth.
It’s how the few have controlled the many all the way back to Babylon, and before.
But they say that the hardest part of solving a problem is recognizing that you have one.
Don Croft used to say “Parasites fear exposure above all else”.
On April 11, 2023, phys.org said “Lake Tahoe’s clarity is the best it’s been in 40 years: Researchers say this animal is helping”.
Scientists with UC Davis’ Tahoe Environmental Research Center said the improved clarity is “due in part to a resurgence of the lake’s native zooplankton,” researchers said in the report. "They’ve provided a natural clean-up crew to help restore the lake’s famous blue waters.
The native zooplankton are small, microscopic animals. Since the 1960s, the zooplankton populations have decreased due to the growth of its primary predator, the Mysis shrimp. Zooplankton, especially the Daphnia and Bosmina species, have dropped to dangerously low levels over the years, hitting a record low in 2021."
Lake Tahoe’s native zooplankton population decreased continuously from the 1960’s through 2021, when it reached a record low.
If Lake Tahoe’s native zooplankton is a “natural cleanup crew”, as stated by the UC Davis Tahoe Environmental Research Center, then how or why could Lake Tahoe’s clarity have increased by 18% from 2018 to 2019, in the presence of a near-record-low population of those native zooplankton?
Further, if Lake Tahoe’s native zooplankton experienced a “resurgence” in 2022, albeit from some undocumented number or density to some other undocumented number or density, and that native zooplankton is the “natural clean-up crew” alleged by the UC Davis Tahoe Environmental Research Center to have effected that resurgence, then why or how could the plankton-free 18% increase in Lake Tahoe’s water clarity from 2018 to 2019 be 1,700% greater than its purportedly plankton-driven 1% increase in clarity from 2021 to 2022?
I’ll have to beg the reader to recall that Jesse Patterson, Chief Strategy Officer for the League to Save Lake Tahoe said that the 18% increase in clarity from 2018 to 2019 was because of “fluctuating weather patterns”. He didn’t mention anything about native zooplankton.
You may have noticed that the UC Davis Taho Environmental Research Center didn’t offer any suggestion as to what had caused the sudden yet unquantified “resurgence” in native Zooplankton in Lake Tahoe in 2022. That’s an example of the propaganda technique known as “stonewalling”.
Here’s Jesse Patterson’s picture, with Satanic purple background, and where the image is constructed to focus attention on his left eye:

(Jesse Patterson, Chief Strategy Officer, League to Save Lake Tahoe, who said that the 18% increase in clarity in Lake Tahoe from 2018 to 2019 was because of “fluctuating weather patterns”.)
The photo captures Jesse in the act of telling a baldfaced lie while retaining the firmness of purpose that goes with complete honesty.
The image features his left eye because, to generational Satanist Freemasons like Jesse, the left eye is the “eye of Will” or the “eye of Horus”.
But don’t take my word for it:
‘The right eye is the Eye of Ra and the left is the Eye of Horus’.”
From “Freemasonry - Religion And Belief - The 3rd Temple”
Facebook: “Welcome to the Left-Hand-Path-Network, where Satanism is not about worship, but it’s study.”
I have included Jesse’s picture so that you could get a better idea of what a generational Satanist Freemason in a position of marginal influence looks like.
He figured that the rubes would never notice the coded visual imagery.
They are all related to one another through the maternal bloodline. They comprise between twenty and thirty percent of the populace, and are hiding in plain sight in every city, town and village on Earth.
It’s how the few have controlled the many all the way back to Babylon, and before.
But they say that the hardest part of solving a problem is recognizing that you have one.
Don Croft used to say “Parasites fear exposure above all else”.
On August 10, 2023, Nevada Today questioned "Why has the water clarity of Lake Tahoe improved?"
Sudeep Chandra, director of the Ozmen Institute for Global Studies and the Global Water Center and a professor at the University of Nevada, Reno, said “One thing to point out is the clarity has not improved dramatically as stated in the various press coverage.”
Here’s Sudeep Chandra’s picture, where the image is constructed to focus attention on his left eye:

(Sudeep Chandra, director of the Ozmen Institute for Global Studies and the Global Water Center and a professor at the University of Nevada, Reno, who said “clarity has not improved dramatically as stated in the various press coverage.” When, in fact, Lake Tahoe’s water clarity increased by 19% from 2018 to 2023, from 60.4 feet to 71.7 feet. I have exposed his duplicity by using what was known in the old days as “fact checking”.)
The image features his left eye because, to generational Satanist Freemasons like Sudeep, the left eye is the “eye of Will” or the “eye of Horus”.
But don’t take my word for it:
‘The right eye is the Eye of Ra and the left is the Eye of Horus’.”
From “Freemasonry - Religion And Belief - The 3rd Temple”
Facebook: “Welcome to the Left-Hand-Path-Network, where Satanism is not about worship, but it’s study.”
I have included Sudeep’s picture so that you could get a better idea of what a generational Satanist Freemason in a position of marginal influence looks like.
He figured that the rubes would never notice the coded visual imagery.
They are all related to one another through the maternal bloodline. They comprise between twenty and thirty percent of the populace, and are hiding in plain sight in every city, town and village on Earth.
It’s how the few have controlled the many all the way back to Babylon, and before.
But they say that the hardest part of solving a problem is recognizing that you have one.
Don Croft used to say “Parasites fear exposure above all else”.
On August 24, 2023, smithmountaineagle.com said "2023 SMLA Water Quality Monitoring Program results conclude water quality of lake to be ‘very good’.
The uncredited article goes on to say "There are three benchmarks against the SMLA compares the results of its water quality monitoring program: They include:
Secchi Depth: a measure of water clarity;
Chlorophyll: a concentration, or measure of algae growth; and
Phosphorous: a concentration, or measure of nutrient pollution."
The article blacks out any information on Secchi Depth/water clarity.
For those unaware, anytime an author is uncredited, it is proof that said author is an Intelligence operative.
On December 26, 2023, news.wm.edu said “The 2023 Chesapeake Bay dead zone is the smallest on record”.
Where the uncredited author from William and Mary said “smallest on record” because it’s general.
As a propagandist, they know that, since seventy percent of readers only read the headlines, this hedging generality goes a long way toward blunting awareness of the scope of the sudden, exponential decrease in the size of the Chesapeake Bay dead zone which they are attempting to obfuscate.
“Smallest on record” holds out the queasy hope that there had been plenty of other years with smaller dead zones, only nobody recorded them.
An honest journalist would have written “smallest in history”, or “smallest since record-keeping began”.
For those unaware, anytime an author is uncredited, it is proof that said author is an Intelligence operative.
The article goes on to say:
“The combination of pollution reduction practices and below-average rainfall result in a historically small dead zone.”
Where the general plausible-deniability excuses of “pollution reduction practices” and “below-average rainfall” have been used in place of the truth, that the improvement of the health of the ether is driving the increase in health of the Chesapeake Bay.
The article goes on to say “The Virginia Institute of Marine Science’s annual report of “dead-zone” conditions in the Chesapeake Bay indicates that hypoxic, low-oxygen conditions in 2023 were at their lowest since monitoring began in 1985. These results concur with a separate report issued by the Chesapeake Bay Program in conjunction with the Maryland Department of Natural Resources (MD DNR).”
Did you notice how, with “lowest since monitoring began” and “these results”, that there’s no mention of the current size, or the previous size, or the difference between the two? That’s an example of the propaganda technique known as “compartmentalization”.
The article goes on to say:
The words “mystery”, “baffled” and “puzzled” are memes, used, among numerous similar variants, whenever anyone in the wholly-controlled-and-coopted Political, Academic, Scientific and Media establishments wants to lie about, well, basically anything. One of those many variants is “surprised”.
That’s why uncredited Intelligence operative from William and Mary article goes on to say “The low levels of hypoxia in 2023, despite the high temperatures, are truly surprising,” said Marjy Friedrichs, professor at William & Mary’s Virginia Institute of Marine Science. “This may finally be clear evidence that our nutrient reduction strategies are improving water quality and fish and shellfish habitats.”
Where Marjy Friedrichs, professor at William and Mary’s Virginia Institute of Marine Science walked the lowest levels of hypoxia in the history of Chesapeake Bay back to merely “low”, and then attributed their decrease to the lowest level in history to “our nutrient reduction strategies”.
Despite the fact that she studies Marine Science for a living, Mary is pretending to not be aware that water quality and clarity are increasing regardless of geography.
That’s an example of the propaganda technique known as “compartmentalization”.
Magnificently, she puts forward the general “despite the high temperatures” to obscure the fact that the climate is, in fact, cooling markedly.
Here’s Marjy Friedrichs picture:

(Marjy Friedrichs, professor at William and Mary’s Virginia Institute of Marine Science, who described the smallest Chesapeake Bay dead zone in history, 46% below average as “low levels of hypoxia”, said it was "truly surprising”, and that it was caused by “our nutrient reduction strategies”.
For those unaware, anytime someone says “truly”, they are lying bald-facedly.)
I have included Marjy’s picture so that you could get a better idea of what a generational Satanist Freemason in a position of marginal influence looks like.
Generational Satanists are all related to one another through the maternal bloodline. They comprise between twenty and thirty percent of the populace, and are hiding in plain sight in every city, town and village on Earth.
It’s how the few have controlled the many all the way back to Babylon, and before.
But they say that the hardest part of solving a problem is recognizing that you have one.
Don Croft used to say “Parasites fear exposure above all else”.On January 4, 2024, cleanlakesalliance.org published “2023 Water Quality Monitoring Results”.
Where, under the false guise of familiarity, the uncredited author from the Clean Lakes Alliance wrote the headline in a completely general way, so that you can’t tell what water was monitored, who was doing the monitoring, and what the results were.
That’s because, as a propagandist, they know that seventy percent of readers only read the headlines, and this hedging generality goes a long way toward blunting awareness of the scope of the sudden, exponential in water clarity which they are attempting to obfuscate.
For those unaware, anytime an author is uncredited, it is proof that said author is an Intelligence operative.
The uncredited Intelligence operative from the State propaganda organ known as cleanlakealliance.org goes on to say “During the 2023 monitoring season, low spring and summer rainfall volume and intensity coincided with good water clarity, resulting in higher green algae but fewer cyanobacteria blooms across the five lakes.”
Where the uncredited Intelligence operative from the State propaganda organ known as clearlakealliance.org walked the highest water clarity back to merely “good”, and said that it had been caused by “low spring and summer rainfall volume and intensity”.
The word “intensity” has three syllables, and has been tacked on the end to amaze the Punch and Judy crowd.
Here’s a picture from the Clean Lakes Alliance article of one of the lakes, where the water is the cleanest and clearest that it has ever been, in history:
(Unnamed one of Lakes Mendota, Monona, Waubesa, Wingra and Kegonsa in Wisconsin. The editor who put the article together for the Clean Lakes Alliance did what little they could to hedge by omitting the name, to make the subject that much less searchable. That’s an example of the propaganda technique known as “compartmentalization”.)
The actual data on water clarity is, in journalistic parlance, “buried” twelve paragraphs down in the article.
For grade school children studying the subject in the future, asking the average American in 2024 to read twelve paragraphs is like asking someone from 1947 to swim the English channel.
From 2020 to 2023, the average clarity of Lakes Mendota, Monona, Waubesa, Wingra and Kegonsa in Wisconsin increased by 17.2%, from 87 centimeters to 102 centimeters.
From 2020 to 2021, the average clarity of Lakes Mendota, Monona, Waubesa, Wingra and Kegonsa in Wisconsin decreased by 1.1%, from 87 centimeters to 86 centimeters.
From 2021 to 2022, the average clarity of Lakes Mendota, Monona, Waubesa, Wingra and Kegonsa in Wisconsin increased by 10.5%, from 86 centimeters to 95 centimeters.
From 2022 to 2023, the average clarity of Lakes Mendota, Monona, Waubesa, Wingra and Kegonsa in Wisconsin increased by 7.4%, from 95 centimeters to 102 centimeters.
The article goes on to say:
"Average nearshore clarity for 2023 was up for all lakes compared to last year’s averages. All lakes except for Mendota reported the highest clarity readings since LakeForecast monitoring started in 2014 (Figure 3). All five lakes fell within the “good” water clarity designation represented in Figure 4.
Nearshore water clarity from 2014 to 2023 is measured in centimeters using a turbidity tube. The maximum value for the turbidity tube is 120 centimeters, indicating the clearest waters. Lines for average clarity are overlaid in the three different classifications for turbidity: Good (80-120 cm), Fair (50-80 cm), and Murky (0-50 cm)."
If the water in the five lakes under discussion is the clearest it’s ever been in history, why is its water clarity designation merely “good”, versus excellent?
I have exposed the duplicity of the Clean Lakes Alliance by using what was known in the old days as “fact checking”.
Jeff Miller, Brooklyn, New York, March 5, 2021
If you’d like to be added to this free mailing list, or know someone who would be, please send me a note at [email protected]
You can access these articles online at https://forum.orgones.co.uk/c/positive-changes-that-are-occurring/