“The function of wisdom is to discriminate between good and evil.”
― Marcus Tullius Cicero
Great positive changes are underway at every level of our reality. I began writing this series of articles on the subject, entitled “Positive Changes That Are Occurring”, in July of 2013, on Don Croft’s Etheric Warriors forum.
The use of Death energy, or what Wilhelm Reich called Dead Orgone Radiation to augment and steer storms predates what we call “modern” technology.
During the 1500’s, Queen Elizabeth the 1st’s sidekick Black magician John Dee is famously known to have conjured the storm that wrecked the Spanish Armada.
John Dee signed his secret letters “007”, which is where the Illuminist Ian Fleming got British Secret Agent James Bond’s supposedly randomly-generated number.

(John Dee’s “007” Signature)

(James Bond as “007”)
Same literally blood-drinking Illuminist shit, different Century, I’m afraid.
Here’s a picture of Queen Elizabeth and John Dee, where she’s wearing a Satanic purple dress with a human sacrifice pyramid neckline, and where the image is constructed to focus attention on their left eyes.

(John Dee and Queen Elizabeth I)
To bloodline-linked Illuminists like Queen Elizabeth I and John Dee, the left eye is the “eye of Will” or the “eye of Horus”.
‘The right eye is the Eye of Ra and the left is the Eye of Horus’.”
From “Freemasonry - Religion And Belief - The 3rd Temple”
Facebook: “Welcome to the Left-Hand-Path-Network, where Satanism is not about worship, but it’s study.”
I have included this picture of Queen Elizabeth I and John Dee so that you could get a better idea of what generational Satanist Freemason of significant influence look like.
They are all related to one another through the maternal bloodline. Generational Satanists comprise between twenty and thirty percent of the populace, and are hiding in plain sight in every city, town and village on Earth.
It’s how the few have controlled the many all the way back to Babylon, and before.
But they say that the hardest part of solving a problem is recognizing that you have one.
Don Croft used to say “Parasites fear exposure above all else”.
In 1856, Physicist John Tyndall fabricated the hedging generality “the greenhouse effect” to obscure the fact that increased levels of Dead Orgone Energy in the ether increase air and water temperature.
The discovery of the greenhouse effect is attributed to several scientists over time. Joseph Fourier first proposed the concept in the 1820s, suggesting that the Earth’s atmosphere traps heat. Eunice Foote later demonstrated the effect of carbon dioxide in trapping heat in 1856. Finally, John Tyndall provided experimental evidence in 1859, identifying specific gases like carbon dioxide and water vapor as key absorbers of infrared radiation.
AI Overview
Tyndall identified carbon dioxide and water vapor as key absorbers of infrared radiation, while leaving carefully unmentioned the fact that they are also key absorbers of Dead Orgone Radiation.
fabricated - verb - past tense: invent or concoct (something), typically with deceitful intent.
Here’s a portrait of Physicist John Tyndall, the Patron Saint of the “greenhouse effect”, where he has his hand against his face in a purportedly-secret Masonic “gesture of recognition”.

(Physicist John Tyndall)
Now, for any Coincidence Theorists lingering in the readership, here are a variety of 19th Century depictions of Masonic “gestures of recognition”, including the hand-to-face gesture used by John Tyndall in the portrait immediately above.

(19th Century depictions of Masonic “gestures of recognition”.)
I have included John Tyndall’s portrait so that you could get a better idea of what generational Satanist Freemason of significant influence looks like.
They are all related to one another through the maternal bloodline. Generational Satanists comprise between twenty and thirty percent of the populace, and are hiding in plain sight in every city, town and village on Earth.
It’s how the few have controlled the many all the way back to Babylon, and before.
But they say that the hardest part of solving a problem is recognizing that you have one.
Don Croft used to say “Parasites fear exposure above all else”.
From 1871 to 2020, the long-term average annual precipitation for Baltimore, Maryland was 45.6 inches.
From 1871 to 2020, annual precipitation in Baltimore, Maryland increased by an annual average of .122%.
From 1871 to 2020, annual precipitation in Baltimore, Maryland increased by 18.3%.
From 1871 to 2010, annual precipitation in Baltimore, Maryland increased by an annual average of .082%.
From 1871 to 2010, annual precipitation in Baltimore, Maryland increased by 11.5%.
From 1871 to 2000, annual precipitation in Baltimore, Maryland increased by an annual average of .003%.
From 1871 to 1880, Baltimore, Maryland had 413.4 inches of precipitation.
From 1871 to 2000, annual precipitation in Baltimore, Maryland increased by .4%.
From 1871 to 1990, annual precipitation in Baltimore, Maryland increased by an annual average of .028%.
This decrease in precipitation from 1870 to 1990 refutes the false claim that increasing levels of Carbon Dioxide in the atmosphere are driving a greenhouse effect” which increases air temperature and rainfall.
From 1871 to 1990, annual precipitation in Baltimore Maryland decreased by 3.4%.
From 1871 to 1980, annual precipitation in Baltimore, Maryland increased by an annual average of .094%.
From 1871 to 1980, annual precipitation in Baltimore Maryland increased by 10.4%
From 1871 to 1970, annual precipitation in Baltimore, Maryland increased by an annual average of .79%.
From 1871 to 1970, annual precipitation in Baltimore Maryland decreased by 7.9%.
This refutes the false claim that increasing levels of Carbon Dioxide in the atmosphere are driving a “greenhouse effect” which increases air temperature and rainfall.
From 1871 to 1960, annual precipitation in Baltimore Maryland decreased by an annual average of .087%.
From 1871 to 1960, annual precipitation in Baltimore Maryland decreased by 4.6%.
From 1871 to 1950, annual precipitation in Baltimore, Maryland increased by an annual average of .06%.
From 1871 to 1950, annual precipitation in Baltimore Maryland increased by 4.8%
From 1871 to 1940, annual precipitation in Baltimore Maryland increased by 13.7%.
From 1871 to 1930, annual precipitation in Baltimore Maryland increased by 2.8%
From 1871 to 1920, annual precipitation in Baltimore Maryland increased by 4.59%.
From 1871 to 1910, annual precipitation in Baltimore Maryland increased by 5.4%.
From 1871 to 1900, annual precipitation in Baltimore Maryland increased by .5%.
From 1871 to 1880, Baltimore, Maryland had 413.4 inches of precipitation.
From 1871 to 1880, the annual average rainfall of Baltimore, Maryland was 41.3 inches.
From 1871 to 1880, Baltimore, Maryland’s average annual precipitation of 41.3 inches was 10% below the long term annual average of 45.6 inches from 1871 to 2020.
From 1880 to 1890, the annual average rainfall of Baltimore Maryland was 47.2 inches.
From 1880 to 1890, Baltimore, Maryland had 472.4 inches of precipitation.
From 1880 to 1890, Baltimore, Maryland’s average annual precipitation of 47.2 inches was 3.3% above the long-term annual average of 45.6 inches from 1871 to 2020.
Since this statistic is so early in the “industrial era”, it suggests that the thesis that increasing levels of Carbon Dioxide in the atmosphere are driving a “greenhouse effect” which increases air temperature and rainfall is false.
From 1880 to 1890, Baltimore, Maryland’s average annual precipitation of 47.2 inches was 14.3% greater than its average of 41.3 inches from 1871 to 1880.
Since this statistic is so early in the “industrial era”, it suggests that the thesis that increasing levels of Carbon Dioxide in the atmosphere are driving a “greenhouse effect” which increases air temperature and rainfall is false.
Rather, we may infer that, prior to radio really getting underway in earnest, the health of the ether was improving significantly, going forward in time.
If precipitation varies directly with the health of the ether, then here we see the health of the ether improving significantly from 1870 to 1890.
From 1881 to 1911, the average temperature in Minnesota’s Twin Cities area decreased by 2.2%, from 46.1 degrees to 45.1 degrees. From 1911 to 2016, the average temperature in Minnesota’s Twin Cities area increased by 10.2%, and then decreased by 6.6% from 2016 to 2018, or by 4.6 degrees, from 45.1 degrees to 49.7 degrees.
If a carbon-driven “greenhouse effect” existed, the hyper-exponential 6.6% decrease of 4.6 degrees from 2016 to 2018 would not be possible.
From 1881 to 2016, the average temperature in Minnesota’s Twin Cities area increased by .65%, or by .3 degrees, from 46.1 degrees to 46.4 degrees.
If carbon-driven increases in temperature are factual, then how could the temperature in Minnesota’s Twin Cities increase by just one third of one degree from 1881 to 2016?
Carbon-driven increases in temperature are a ruse.
ruse - noun - an action intended to deceive someone; a trick.
From 1881 to 1911, the average temperature in Minnesota’s Twin Cities area decreased by an annual average of .07%.
From 1881 to 1911, the average temperature in Minnesota’s Twin Cities area decreased by 2.2%, from 46.1 degrees to 45.1 degrees.
In 1881, the average temperature in Minnesota’s Twin Cities area was 46.1 degrees.
From 1890 to 1900, Baltimore, Maryland had 403 inches of precipitation.
From 1890 to 1900, Baltimore, Maryland’s average annual precipitation of 40.3 inches was 13% below the long-term average of 45.6 inches from 1871 to 2020.
We’ve gone from 14.3% above the long-term average from 1880 to 1890 to 13% below the long-term average from 1890 to 1900.
From 1890 to 1900, Baltimore, Maryland’s 403 inches of precipitation was 14.7% less, or 69.4 inches less, than its 472.4 inches from 1880 to 1890, and 2.5% less, or 10.4 inches less than its 413.4 inches from 1870 to 1880.
If precipitation varies directly with the health of the ether, then here we see the health of the ether degrading significantly from 1890 to 1900, to a level slightly below that of 1870 to 1880.
From 1890 to 1900, the 13% decrease below the mean precipitation in Baltimore, Maryland from 1871 to 2020 was 190.9% greater, or almost three times greater than the 14.3% increase above the mean from 1880 to 1890.
In the 1890s, significant advancements in wireless communication occurred, particularly with the development of radio technology. While many scientists and inventors contributed to the field, Guglielmo Marconi is widely recognized for developing the first practical wireless telegraphy system. His work, building on the theories of Maxwell and experiments of Hertz, led to the creation of a functional system for long-distance radio communication using Morse code, allowing for the transmission of telegraph messages without the need for physical wires, using radio waves instead. While scientists had been exploring this concept for decades, Marconi’s work in the 1890s led to the first practical and widely adopted wireless telegraph systems.
AI Summary
They key in the AI summary immediately above is “wireless communication”, poisoning the ether with the immediate, concrete impact which have documented here.
Here’s a picture of Guglielmo Marconi, where he has his hand against his face in a purportedly-secret Masonic “gesture of recognition”.
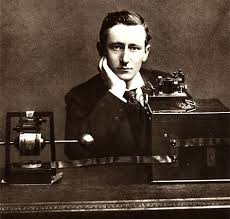
(Guglielmo Marconi)
Now, for any Coincidence Theorists in the readership, here is a photo of Theosophy founder Helena Blavatsky, with her hand against her face in the same purportedly-secret Masonic “gesture of recognition” that Guglielmo Marconi is using in the photo immediately above.
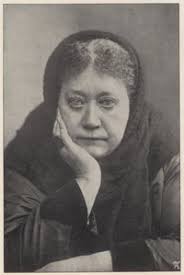
(Theosophy founder Helena Blavatsky)
And, because some respect only the lash, here are a variety of 19th Century depictions of Masonic “gestures of recognition”, including the hand-to-face gesture that Theosophy founder Helena Blavatsky and wireless technology pioneer Guglielmo Marconi are in the two photos immediately above.
(19th Century depictions of Masonic “gestures of recognition”.)
I have included Guglielmo Marconi’s picture so that you could get a better idea of what generational Satanist Freemason of significant influence looks like.
They are all related to one another through the maternal bloodline. Generational Satanists comprise between twenty and thirty percent of the populace, and are hiding in plain sight in every city, town and village on Earth.
It’s how the few have controlled the many all the way back to Babylon, and before.
But they say that the hardest part of solving a problem is recognizing that you have one.
Don Croft used to say “Parasites fear exposure above all else”.
From 1895 to 2018, New Jersey’s annual precipitation record increased by an annual average of .6%.
From 1895 to 2018, New Jersey’s annual precipitation record increased by 73.9%, or by 25.23 inches, or by over two feet, from 38.86 inches to 64.79 inches.
From 1895 to 1996, New Jersey’s annual precipitation record increased by an annual average of .62%.
From 1895 to 1996, New Jersey’s annual precipitation record increased by 62.7%, or by 23.12 inches, from 36.86 inches to 59.98 inches.
In 1895, Baton Rouge, Louisiana set its all-time snowfall record of 12.5 inches.
In 1895 New Jersey set the state’s first annual precipitation record, at 36.86 inches.
To clarify, the New Jersey state precipitation record remained unbroken for over 100 years, from 1895 to 1996. Then, in 1996, it was suddenly broken by almost two thirds, or by nearly two feet of precipitation.
From 1895 to 1996, the .62% average annual increase in New Jersey’s annual precipitation record was 3.3% greater than its .60 long-term average documented from 1895 to 2018.
There was a sudden, hyper-exponential change for the better in 1996.
It was that great positive change that led to the deployment of the literal forest of what we collectively refer to as “cell phone towers” in every city, town and village on Earth in the late 1990’s.
In the mid-1890s, building on techniques physicists were using to study electromagnetic waves, Guglielmo Marconi developed the first apparatus for long-distance radio communication.
From 1900 to 2018, Tampa Bay, Florida’s daily rainfall record increased by an annual average of 1%.
From 1900 to 2018, Tampa Bay, Florida’s daily rainfall record increased by 117.8%, or by more than two times, or by 1.79 inches, from 1.52 inches to 3.31 inches.
From 1900 to 1910, Baltimore, Maryland’s average annual precipitation of 42.2 inches was 8% below the long-term average of 45.6 inches from 1871 to 2020.
From 1900 to 1910, the 8% decrease below the mean precipitation in Baltimore, Maryland from 1871 to 2020 was 38.5% less than its 13% decrease below the mean from 1890 to 1900.
Here, from 1900 to 1910, we see that the ether is increasing in health at a rate greater than that of the nascent technologies of the era to mitigate it.
In 1900, Tampa Bay, Florida set a new daily rainfall record of 1.52 inches.
On December 23, 1900, the Canadian-born American inventor Reginald A. Fessenden became the first person to send audio (wireless telephony) by means of electromagnetic waves, successfully transmitting over a distance of about a mile (1.6 kilometers,) and six years later on Christmas Eve 1906 he became the first person to make a public wireless broadcast.
In 1904, a German engineer, Hulsmeyer, was granted a patent in several countries on a proposed method of using electromagnetic waves in an obstacle detector and navigation aid for ships.
From 1910 to 1920, Baltimore, Maryland’s average rainfall of 42 inches per year was 8.6% below the long term average of 45.6 inches from 1871 to 2020.
From 1910 to 1920, the 8.6% decrease below the mean precipitation in Baltimore, Maryland from 1871 to 1920 was 7.5% greater than its 8% decrease from 1900 to 1910.
The cumulative poisoning of the ether is gaining traction.
By 1910, various wireless systems had come to be called “radio”. That’s why, after decreasing steadily from 1881 to 1911, the temperature in Minnesota’s Twin Cities area began to increase in 1911.
From 1911 to 2016, the average temperature in Minnesota’s Twin Cities area increased by 10.2%, and then decreased by 6.6% from 2016 to 2018, or by 4.6 degrees, from 45.1 degrees to 49.7 degrees.
If a carbon-driven “greenhouse effect” existed, the hyper-exponential 6.6% decrease of 4.6 degrees from 2016 to 2018 would not be possible.
Tyndall identified carbon dioxide and water vapor as key absorbers of infrared radiation, while leaving carefully unmentioned the fact that they are also key absorbers of Dead Orgone Radiation.
That’s why temperatures in Minnesota’s Twin Cities area began to increase in 1911, when radio came into being, beaming its signals through the ether.
From 1911 to 2016, the average temperature in Minnesota’s Twin Cities area increased by 10.2%, and then they decreased by 6.6% from 2016 to 2018.
They increased by 10.2% from 1911 to 2016 not because of “carbon driven global warming”, but rather because of the decrease in health of the ether over that time period. They then decreased by almost ten percent in just two years from 2016 to 2018 because the health of the ether was inexorably improving.
Air temperature varies directly with the health of the ether.
From 1911 to 2016, the average temperature in Minnesota’s Twin Cities area increased by an annual average of .097%.
From 1911 to 2016, the average temperature in Minnesota’s Twin Cities area increased by 10.2%, from 45.1 degrees to 49.7 degrees.
From 1911 to 1983, the average temperature in Minnesota’s Twin Cities area increased by an annual average of .018%
From 1911 to 1983, the annual rainfall total in Minnesota decreased by an annual average of .048%.
From 1911 to 1983, the respective .018% average annual increase in temperature and .048 decrease in rainfall in Minnesota’s Twin Cities area were statistically very similar.
Air temperature and precipitation vary directly with the health of the ether.
From 1911 to 1983, the average temperature in Minnesota’s Twin Cities area increased by 1.3%, or by .6 degrees. from 45.1 degrees to 45.7 degrees.
From 1911 to 1983, the annual rainfall total in Minnesota decreased by 3.5%, or by 1.43 inches, from 40.5 inches to 39.07 inches.
In 1911, the annual rainfall total in Minnesota was 40.5 inches.
In 1911, the average temperature in Minnesota’s Twin Cities area was 45.1 degrees.
From 1915 to 2018, Grand Island, Michigan’s daily snowfall record increased by an annual average of 1.42%.
From 1915 to 2018, Grand Island, Michigan’s daily snowfall record increased by 146%, or by basically one and a half times, or by 4.4 inches, from 3 inches to 7.4 inches.
In 1915, Grand Island Michigan set a new daily snowfall record of 3 inches.
From 1916 to 2016, Flagstaff, Arizona’s daily snowfall record increased by an annual average of 1.46%.
From 1916 to 2016, the respective 1.42% and 1.46% increases in Grand Island, Michigan’s daily snowfall record and Flagstaff, Arizona’s daily snowfall record were statistically identical.
Precipitation is increasing at very similar rates regardless of geography because the health of the ether is inexorably improving, and precipitation varies directly with the health of the ether.
From 1916 to 2016, the respective 1% and 1.46% average annual increases in Tampa Bay, Florida’s daily rainfall record and Flagstaff, Arizona’s daily snowfall record were statistically almost identical.
Precipitation is increasing at very similar rates regardless of geography because the health of the ether is inexorably improving, and precipitation varies directly with the health of the ether.
From 1916 to 2016, Flagstaff, Arizona’s daily snowfall record increased by 146%, or by basically one and a half times, or by six inches, from 4.1 inches to 10.1 inches.
In 1916, Flagstaff, Arizona’s daily snowfall record was 4.1 inches.
From 1920 to 1930, Baltimore, Maryland’s average annual precipitation of 42.3 inches was 17.8% below the long-term average of 45.6 inches from 1871 to 2020.
From 1920 to 1930, the 17.8% decrease below the mean in precipitation in Baltimore, Maryland from 1871 to 2020 was 106.9% greater, or more than two times greater than its 8.6% decrease below the mean from 1910 to 1920.
From 1920 to 1930, the 106.9% positive variance in the decrease below the mean in precipitation in Baltimore, Maryland from 1871 to 2020 versus 1910 to 1920 was 1,325.3% greater, or more than fourteen times greater than its 7.5% positive variance from 1910 to 1920 versus 1900 to 1910.
I’m guessing that this sudden, hyper-exponential decrease in precipitation was driven not only by the ongoing, cumulative impact of wireless telegraph, ever-expanding electrical grids and radio, et al, but also by the Death energy generated during World War I.
In 1925, the Carnegie Institution initiated ionospheric studies, using pulsed radio waves. Further experiments and study by Lawrence Hyland (U.S. Navy Research Labs) indicated (by 1930) that it was practical to detect both ships and aircraft using continuous waves.
In 1927, Philo Farnsworth developed an early electronic television system, including the “image dissector” tube.
In 1929, the first practical, all-electronic television system for both transmission and reception was demonstrated by Vladimir Zworykin in 1929.
From 1930 to 1940, Baltimore, Maryland had 468.8 inches of precipitation.
From 1930 to 1940, Baltimore, Maryland’s average annual precipitation of 46.9 inches was 2.8% above the long-term average of 45.6 inches from 1871 to 2020.
In 1937, the British commenced the construction of a network of land-based radar early-warning stations. This project placed the British far ahead of other nations in the development of radar technology.
In 1939, RCA, under David Sarnoff, began regular telecasts in the US, including the opening of the World’s Fair and the first televised baseball game.
From 1939 to 2017, Amarillo, Texas’ daily rainfall record for August 9 increased by an annual average of .55%.
In 1939, Amarillo, Texas set a new daily rainfall record for August 9 of 1.69 inches.
From 1939 to 2017, Amarillo, Texas’ daily rainfall record for August 9 increased by 42.6%, from 1.69 inches to 2.41 inches.
From 1940 to 1950, Baltimore, Maryland’s average annual precipitation of 42.3 inches was 7.8% below the long-term average of 45.6 inches from 1871 to 2020.
From 1940 to 1950, the 7.8% decrease below the mean in precipitation in Baltimore, Maryland from 1871 to 2020 was 178.5% greater, or almost three times greater than its 2.8% decrease below the mean from 1930 to 1940.
From 1940 to 1950 versus 1930 to 1940, the 178.5% positive variance in the decrease below the mean in precipitation in Baltimore, Maryland from 1871 to 2020 was 67% greater, or two thirds greater than its 106.9% positive variance from 1920 to 1930 versus 1910 to 1920.
I’m guessing that this decrease in precipitation was driven not only by the ongoing, cumulative impact of wireless telegraph, ever-expanding electrical grids, radio, radar, television, et al, but also by the Death energy from World War II.
From 1942 to 2017, Philadelphia, Pennsylvania’s daily snowfall record for December 9 increased by an annual average of .18%.
From 1942 to 2017, Philadelphia, Pennsylvania’s daily snowfall record for December 9 increased by 13.8%, or by .4 inches, from 2.9 inches to 3.3 inches.
In 1942, Philadelphia, Pennsylvania set a new daily snowfall record for December 9 of 2.9 inches.
From 1946 to 2014, North Carolina’s daily snowfall record for January 16 at North Carolina’s Raleigh-Durham University increased by an annual average of .69%.
From 1946 to 2018, North Carolina’s daily snowfall record for January 16 at North Carolina’s Raleigh-Durham University increased by 47%, or by 5.9 inches, from 4 inches to 5.9 inches.
From 1946 to 2014, the respective .6% and .69% average annual increases in New Jersey’s annual precipitation record and in North Carolina’s daily snowfall record for January 16 at North Carolina’s Raleigh-Durham University were statistically identical.
Precipitation is increasing at very similar rates regardless of geography because the health of the ether is inexorably improving, and precipitation varies directly with the health of the ether.
In 1946, North Carolina’s set a daily snowfall record for January 16 at North Carolina’s Raleigh-Durham University of 4 inches.
From 1947 to 2017, Ottawa, Canada’s snowfall record for February 6 increased by an annual average of .37%,
From 1947 to 2017, Ottawa, Canada’s snowfall record for February 6 increased by 26.1%, or by more than one fourth, or by 9.6 centimeters, from 40.6 centimeters to 51.2 centimeters.
In 1947, Ottawa, Canada set a new snowfall record for February 6 of 40.6 centimeters.
From 1950 to 2020, the .122% average annual increase in annual precipitation in Baltimore, Maryland was 103.3% greater, or more than two times greater than its .06% average annual decrease from 1870 to 1960.
Given that we’ve learned that precipitation in Baltimore, Maryland decreased by an annual average of .028% from 1870 to 1990, and presuming that precipitation varies directly with the health of the ether, this statistic documents that the health of the ether improved exponentially from 1950 to 2020.
From 1950 to 1960, Baltimore, Maryland had 425.9 inches of precipitation.
From 1950 to 1960, Baltimore, Maryland’s average annual precipitation of 42.6 inches was 7% below the long term average of 45.6 inches from 1871 to 2020.
Given that we’ve learned that precipitation in Baltimore, Maryland decreased by an annual average of .028% from 1870 to 1990, and presuming that precipitation varies directly with the health of the ether, this statistic documents that the health of the ether decreased significantly from 1950 to 1960.
From 1951 to 2017, Portland, Oregon’s daily rainfall record for October 21 increased by an annual average of .01%.
From 1951 to 2017, Syracuse New York’s daily snowfall record for December 13 increased by an annual average of .78%.
From 1951 to 2017, Portland, Oregon’s daily rainfall record for October 21 increased by .9%, from 1.10 inches to 1.11 inches.
From 1951 to 2017, Syracuse, New York’s snowfall record for December 13 increased by 50.8%, or by half, or by three inches, from 5.9 inches to 8.9 inches
In 1951, Portland, Oregon set a new daily rainfall record for October 21 of 1.10 inches.
In 1951, Syracuse, New York set a new daily snowfall record for December 13 of 5.9 inches.
From 1953 to 2018, Daytona Beach, Florida’s daily rainfall record increased by an annual average of .9%.
From 1953 to 2018, Daytona Beach, Florida’s daily rainfall record increased by 56%, or by .51 inches, from .91 inches to 1.42 inches.
In January 2018, weather.gov said in comment “Daytona Beach sees more record rainfall”.
Where “sees record rainfall walks Daytona Beach back a step from actually experiencing it, and where “more”, “record” and “rainfall” are all hedging generalities.
The article continues: “Daytona Beach on Tuesday saw 1.42 inches of rain, topping the record of 0.91 inches, set in 1953.”
Where “saw 1.42 inches of rain” once again walks Daytona Beach back a step from actually experiencing it, and where “topped” is a hedging generality, obscuring the fact that the new record is 56% greater than the old.
I have exposed the duplicity of weather.gov by using what was known in the old days as “fact checking”.
In 1954, Baltimore, Maryland had an all-time low precipitation of 27.8 inches, which was 39% below the long-term average of 45.6 inches from 1871 to 2020.
If increased carbon dioxide in the atmosphere is driving increased air temperatures, which temperatures are in turn driving increased rainfall, as claimed, then how could the all time low rainfall number occur smack in the middle of the car boom of the 1950’s, versus in the decades preceding the invention of the automobile?
The claim that increased carbon dioxide in the atmosphere is driving increased air temperatures, which temperatures are in turn driving increased rainfall is false.
From 1955 to 2017, Oklahoma City, Oklahoma’s daily rainfall record for October 4 increased by an annual average of .42%
From 1955 to 2017, the respective .37% and .42% average annual increases in Ottawa, Canada’s snowfall record for February 6 and Oklahoma City, Oklahoma’s daily rainfall record for October 4 were statistically almost identical.
Precipitation is increasing at very similar rates regardless of geography because the health of the ether is inexorably improving, and precipitation varies directly with the health of the ether.
From 1955 to 2017, Oklahoma City, Oklahoma’s daily rainfall record for October 4 increased by 25.7%, or by .57 inches, from 2.22 inches to 2.79 inches.
In 1955, Oklahoma City, Oklahoma set a new daily rainfall record for October 4 of 2.22 inches.
From 1960 to 2020, the .122% average annual increase in annual precipitation in Baltimore, Maryland was 240.2% greater, or more than three times greater than its .087% average annual decrease from 1870 to 1960.
Given that we’ve learned that precipitation in Baltimore, Maryland decreased by an annual average of .028% from 1870 to 1990, this statistic documents that the health of the ether improved exponentially from 1960 to 2020.
From 1960 to 2020, the health of the ether improved exponentially (240.2%)
From 1960 to 1970, Baltimore, Maryland’s rainfall averaged 37.3 inches.
From 1960 to 1970, Baltimore, Maryland had 372.5 inches of precipitation.
From 1960 to 1970, Baltimore, Maryland’s 372.5 inches of precipitation was 9.9% less, or 40.9 inches less than its 413.4 inches of precipitation from 1870 to 1880.
Given that 1870 to 1880 was prior to the invention of the automobile, this decrease in precipitation from 1960 to 1970 versus 1870 to 1880 refutes the false claim that increasing levels of Carbon Dioxide in the atmosphere are driving a “greenhouse effect” which increases air temperature and rainfall.
Rather, this decrease in precipitation in the “modern era” versus the “pre-industrial era” documents the damage to the ether inflicted by the Death energy, or what Wilhelm Reich called Dead Orgone Radiation, from wireless transmissions of radio, radar and television signals, high tension wires, ad infinitum.
From 1960 to 1970, Baltimore, Maryland’s 372.5 inches of precipitation was 12.5% less, or 53.4 inches less, or more than four feet less than its 425.9 inches of precipitation from 1950 to 1960.
Given the steady increase in automobiles and industry from 1960 to 1970 versus 1950 to 1960, this very large decrease in precipitation refutes the false claim that increasing levels of Carbon Dioxide in the atmosphere are driving a “greenhouse effect” which increases air temperature and rainfall.
Given that precipitation varies directly with the health of the ether, this decrease documents the health of the ether has decreased by a large margin from 1960 to 1970 versus 1950 to 1960, thanks to the cumulative increase of Death energy, or what Wilhelm Reich called Dead Orgone Radiation, from wireless transmissions of radio, radar and television signals, high tension wires, ad infinitum.
From 1960 to 1970, Baltimore, Maryland’s 372.5 inches of precipitation was 20.5% less, or one fifth less, or 96.3 inches less, or eight feet less than its 468.8 inches from 1930 to 1940.
Given the exponential increase in automobiles and industry from 1930 to 1940 versus 1960 to 1970, this decrease in precipitation from 1960 to 1970 versus 1930 to 1940 refutes the false claim that increasing levels of Carbon Dioxide in the atmosphere are driving a greenhouse effect” which increases air temperature and rainfall.
Given that precipitation varies directly with the health of the ether, this decrease documents the health of the ether has decreased by a huge margin from 1960 to 1970 versus 1930 to 1940, thanks to the cumulative increase of Death energy, or what Wilhelm Reich called Dead Orgone Radiation, from wireless transmissions of radio, radar and television signals, high tension wires, ad infinitum.
From 1960 to 1970, Baltimore, Maryland’s average rainfall of 37.3 inches was 22% below the long-term average of 45.6 inches from 1871 to 2020.
This refutes the false claim that increasing levels of Carbon Dioxide in the atmosphere are driving a greenhouse effect” which increases air temperature and rainfall.
From 1963 to 2017, Spokane, Washington’s daily snowfall record for December 15 increased by an annual average of .89%.
From 1963 to 2017, the respective .78% and .89% average annual increases in Syracuse, New York’s snowfall record for December 13 and Spokane, Washington’s daily snowfall record for December 15 were statistically almost identical.
Precipitation is increasing at very similar rates regardless of geography because the health of the ether is inexorably improving, and precipitation varies directly with the health of the ether.
In 1963, Spokane, Washington’s daily snowfall record for December 15 was 4.8 inches.
From 1964 to 2019, Springfield, Illinois’ daily snowfall record for January 12 increased by an annual average of .5%.
From 1964 to 2019, Springfield, Illinois’ daily snowfall record for January 12 increased by 27%, or by almost one third, or by 1.8 inches, from 6.6 inches to 8.4 inches.
From 1964 to 2017, the respective .5% and .55% average annual increases in Springfield, Illinois’ daily snowfall record for January 12 and Amarillo, Texas’ daily rainfall record for August 9 were statistically identical.
Precipitation is increasing at very similar rates regardless of geography because the health of the ether is inexorably improving, and precipitation varies directly with the health of the ether.
In 1964, Springfield Illinois set a new daily snowfall record for January 12 of 6.6 inches.
From 1968 to 2017, Colorado Springs, Colorado’s July snowfall record increased by an annual average of .5%.
From 1968 to 2017, the respective .5% and .55% average annual increases in Colorado Springs, Colorado’s July snowfall record and Amarillo, Texas’ daily rainfall record for August 9 were statistically identical.
Precipitation is increasing at very similar rates regardless of geography because the health of the ether is inexorably improving, and precipitation varies directly with the health of the ether.
From 1968 to 2017, Colorado Springs, Colorado’s July snowfall record increased by an annual average of .5%
From 1968 to 2017, Colorado Springs, Colorado’s July snowfall record increased by 24.5%, or by 1.29 inches, from 5.27 inches to 6.65 inches.
In 1968, Colorado Springs, Colorado set a new July snowfall record of 5.27 inches.
From 1970 to 2020, the .122% average annual increase in annual precipitation in Baltimore, Maryland was 84.5% less than its .79% average annual increase from 1870 to 1980.
This refutes the false claim that increasing levels of Carbon Dioxide in the atmosphere are driving a greenhouse effect” which increases air temperature and rainfall, and documents the poisoning of the ether by radio, radar, television and wireless phone and computer technology.
From 1970 to 1990, the health of the ether decreased by an annual average of .69%.
From 1970 to 1990, the health of the ether decreased by 13.8%.
From 1970 to 1990, the .69% average annual decrease in the health of the ether was 220.9% greater, or more than three times greater than its .215% average annual decrease from 1950 to 1970.
From 1970 to 1980, Baltimore, Maryland had 456 inches of precipitation.
From 1970 to 1980, Baltimore, Maryland’s average annual precipitation of 45.6 inches was equal to the long-term annual average of 45.6 inches from 1871 to 2020.
From 1973 to 2017, Squaw Valley (now Palisades Tahoe)’s January snowfall record increased by an annual average of 1.1%.
From 1973 to 2017, the respective 1% and 1.1% average annual increases in Tampa Bay, Florida’s daily rainfall record and Squaw Valley (now Palisades Tahoe)’s January snowfall record were statistically almost identical.
Precipitation is increasing at very similar rates regardless of geography because the health of the ether is inexorably improving, and precipitation varies directly with the health of the ether.
From 1973 to 2017, Squaw Valley (now Palisades Tahoe)’s January snowfall record increased by 49%, or by basically half, from 159 inches to 237 inches.
From 1980 to 2020, the .122% average annual increase in annual precipitation in Baltimore, Maryland was 29.8% greater, or almost one third greater than its .094% average annual increase from 1870 to 1980.
Given that we’ve learned that precipitation in Baltimore, Maryland decreased by an annual average of .028% from 1870 to 1990, this statistic documents that the health of the ether improved significantly from 1980 to 2020.
From 1980 to 2020, the health of the ether improved significantly (29.8%).
From 1980 to 1990, Baltimore, Maryland had 392.9 inches of precipitation.
From 1980 to 1990, Baltimore, Maryland’s 392.9 inches of precipitation was 5.5% greater, or 20.4 inches greater than its 372.5 inches from 1960 to 1970.
Given that precipitation varies directly with the health of the ether, this shows that the health of the ether was increasing from 1960 to 1980.
From 1980 to 1990, Baltimore, Maryland’s 392.9 inches of precipitation was 8.6% less, or 37 inches less, or more than three feet less than its 429.9 inches from 1950 to 1960.
Given the increase in automobiles and industry from 1980 to 1990 versus 1950 to 1960, this decrease in precipitation refutes the false claim that increasing levels of Carbon Dioxide in the atmosphere are driving a greenhouse effect” which increases air temperature and rainfall.
From 1980 to 1990, Baltimore, Maryland’s 392.2 inches of precipitation was 13.8% less, or 63.8 inches less, or more than five feet less than its 456 inches from 1970 to 1980.
Given the increase in automobiles and industry from 1980 to 1990 versus 1970 to 1980, this decrease in precipitation refutes the false claim that increasing levels of Carbon Dioxide in the atmosphere are driving a greenhouse effect” which increases air temperature and rainfall.
From 1980 to 1990, Baltimore, Maryland’s average annual precipitation of 39.3 inches was 16.3% below the long-term annual average of 45.6 inches from 1871 to 2020.
This refutes the false claim that increasing levels of Carbon Dioxide in the atmosphere are driving a “greenhouse effect” which increases air temperature and rainfall.
From 1982 to 2018, the daily snowfall record for January 21 in Yankton, South Dakota increased by an annual average of 2.5%.
From 1982 to 2018, the daily snowfall record for January 21 in Yankton, South Dakota increased by 89%, or by nearly two times, or by 6.7 inches, from 7.5 inches to 14.2 inches.
From 1982 to 2009, Allentown, Pennsylvania’s daily rainfall record for July 11 increased by an annual average of 5%.
From 1982 to 2009, Allentown, Pennsylvania’s daily rainfall record for July 11 increased by 135%.
From 1982-83 to 2016-17, the California water year record increased by an annual average of .24%.
From 1982-83 to 2016-17, average precipitation of rain and melted snow at the Sugar Bowl Ski area in California increased by an annual average of .041%.
From 1983-84 to 2016-17, Boise, Idaho’s snowfall record for December and January increased by an annual average of .48%.
From 1982-83 to 2016-17, average precipitation of rain and melted snow at the Sugar Bowl Ski area in California increased by 1.4%, from 88.5 inches to 89.7 inches. Both years were all-time records.
From 1983-84 to 2017, the respective .48% and .5% average annual increases in Boise, Idaho’s snowfall record for December and January and Colorado Springs, Colorado’s July snowfall record were statistically identical.
Precipitation is increasing at very similar rates regardless of geography because the health of the ether is inexorably improving, and precipitation varies directly with the health of the ether.
From 1983-84 to 2017, the respective .37% and .48% average annual increases in Ottawa, Canada’s snowfall record for February 6 and Boise, Idaho’s snowfall record for December and January were statistically very similar.
Precipitation is increasing at very similar rates regardless of geography because the health of the ether is inexorably improving, and precipitation varies directly with the health of the ether.
In 1982-83, average precipitation of rain and melted snow at the Sugar Bowl Ski area totaled 88.5 inches, the most in history.
From 1982-83 to 2016-17, the California water year record increased by 8%.
From 1983-84 to 2016-17, Boise, Idaho’s snowfall record for December and January increased by 16%, or by nearly one fifth, or by five inches, from 30.5 inches to 35.5 inches.
From 1983 to 2016, the average temperature in Minnesota’s Twin Cities area increased by an annual average of .266%.
From 1983 to 2016, the average temperature in Minnesota’s Twin Cities area increased by 8.8%, from 45.7 degrees to 49.7 degrees.
From 1983 to 2016, the .266% average annual increase in the the average temperature in Minnesota’s Twin Cities area was 454.2% greater, or five and a half times greater than its .048% average annual increase from 1911 to 1983.
That hyper-exponential increase in temperature was not driven by increased carbon dioxide levels, as falsely alleged, but rather by increasing levels of Dead Orgone Radiation in the ether, which raises air and water temperatures. Which is proven by the fact that temperatures in Minnesota’s Twin Cities area decreased suddenly and exponentially from 2016 to 2018, as we reviewed previously.
Carbon Dioxide is put forward in place of “undetectable” Dead Orgone Radiation because the key to any successful Confidence game is misdirection.
In 1983-84, Boise, Idaho set a new snowfall record for December and January of 30.5 inches.
In 1983, the annual rainfall total in Minnesota was 39.07 inches.
In 1983, the average temperature in Minnesota’s Twin Cities area was 45.7 degrees.
From 1985 to 2020, the Pennsylvania state record flathead catfish increased in size by an annual average of .8%.
From 1985 to 2020, the Pennsylvania state record flathead catfish increased in size by 29%, from 43 pounds, 9 ounces to 56.3 pounds.
From 1985 to 2018, the respective .8% and .9% average annual increases in the size of the Pennsylvania state record flathead catfish and in Daytona Beach, Florida’s daily rainfall record were statistically almost identical.
The size of the flathead catfish in Pennsylvania and precipitation in Daytona Beach, Florida are increasing at very similar rates because the health of the ether is inexorably improving, the size, fertility, longevity and very existence of any organism very directly with the health of its etheric environment, and precipitation varies directly with the health of the ether.
In 1985, the Pennsylvania state record flathead catfish weighed 43 pounds, 9 ounces.
From 1988 to 2017, Ottawa, Canada’s daily snowfall record for February 12 increased by an annual average of .51%
From 1988 to 2017, the respective .48% and .51% average annual increases in Boise, Idaho’s snowfall record for December and January and Ottawa, Canada’s daily snowfall record for February 12 were statistically identical.
Precipitation is increasing at very similar rates regardless of geography because the health of the ether is inexorably improving, and precipitation varies directly with the health of the ether.
From 1988 to 2017, Ottawa, Canada’s daily snowfall record for February 12 increased by 14.8%, or by 3.6 centimeters, from 24.4 centimeters to 28 centimeters.
In 1988, Ottawa, Canada set a new daily snowfall record for February 12 of 24.4 centimeters.
From 1990 to 2000, Baltimore, Maryland’s average annual precipitation of 40.8 inches was 11.8% below the long-term annual average of 45.6 inches from 1871 to 2020.
From 1990 to 2000, the health of the ether in Baltimore, Maryland increased by an annual average of 33.5%.
From 1990 to 2000, the .122% average annual increase in annual precipitation in Baltimore, Maryland was 335.7% greater or more than four times greater than its .028% average annual increase from 1870 to 1990.
Given that we’ve learned that precipitation in Baltimore, Maryland decreased by an annual average of .028% from 1870 to 1990, this statistic documents that the health of the ether improved hyper-exponentially from 1990 to 2000.
It also shows the health of the ether improving at an ever-greater rate heading toward the end of the Mayan Long Count in 2012, and it was this exponential improvement that drove the creation and sudden rollout of what we collectively refer to as “cell phone towers” in every city, town and village on Earth in the late 1990’s.
From 1990 to 2000, the health of the ether in Baltimore, Maryland increased by 335.7%, presuming that precipitation varies directly with the health of the ether.
In 1991, Caribou, Maine set a new record for January snowfall of 44.5 inches.
From 1991 to 2019, the mean maximum temperature in the twin cities of Minneapolis and St. Paul in Minnesota decreased by an annual average of .096%.
From 1991, which at the time was purported to be the second-hottest year on record, to 2019, which at the time was purported to be the second-hottest year on record, the mean maximum temperature in the twin cities of Minneapolis and St. Paul in Minnesota decreased by 2.7%, or by 1.5 degrees, from 55 degrees to 53.5 degrees.
From 1991 to 2016, Minnesota’s annual precipitation record increased by an annual average of .2%.
From 1991 to 2016, the respective .18% and .2% average annual increases in Philadelphia, Pennsylvania’s daily snowfall record for December 9 and Minnesota’s annual precipitation record were statistically almost identical.
Precipitation is increasing at very similar rates regardless of geography because the health of the ether is inexorably improving, and precipitation varies directly with the health of the ether.
From 1991 to 2016, Minnesota’s annual precipitation record increased by 5%, or by 2.72 inches, from 53.52 inches to 56.24 inches.
In 1991, the mean maximum temperature in the twin cities of Minneapolis and St. Paul in Minnesota was 55 degrees.
In 1991, Minnesota set a new annual precipitation record of 53.52 inches.
In 1992, the Death energy-based storm steering and augmentation weather warfare system was firing on all cylinders, when Hurricane Andrew was both pumped up and steered in a way that deserves its own made for TV movie. It must have been an exciting dozen years or so for them, culminating in Hurricane Katrina in 2005.
In January 1992, the Washington Post said “1991 is called ‘2nd Warmest’ Year On Record”.
When, in fact, In 1991, Caribou, Maine set a new record for January snowfall of 44.5 inches.
From 1993 to 2018, Central Oregon’s snowfall record for the month of January increased by an annual average of 2%.
From 1993 to 2018, the respective 2% and 2.5% average annual increases in Central Oregon’s snowfall record for the month of January and the daily snowfall record for January 21 in Yankton, South Dakota were statistically almost identical.
Precipitation is increasing at very similar rates regardless of geography because the health of the ether is inexorably improving, and precipitation varies directly with the health of the ether.
From 1993 to 2018, Central Oregon’s snowfall record for the month of January increased by 50%, or by half, or by eight inches, from 16 inches to 24 inches.
From 1993-94 to 2016-17, Bismarck, North Dakota’s snowfall record through January 2 increased by an an annual average of .16%.
From 1993-94 to 2016-17, Bismarck, North Dakota’s snowfall record through January 2 increased by 3.65%, or by 3.8 inches, from 49.3 inches to 53.1 inches.
In 1993, Central Oregon set a new snowfall record for the month of January, at 16 inches.
In 1993-94, Bismarck, North Dakota set a new snowfall record through January 2 of 49.3 inches.
From 1995 to 2018, Caribou, Maine’s monthly precipitation record for December increased by an annual average of .03%.
From 1995 to 2018, Caribou, Maine’s monthly precipitation record for December increased by .71%, from 5.6 to 5.64 inches of rain and melted snow.
From 1995 to 2017, the respective .01% and .03% average annual increases in Portland, Oregon’s daily rainfall record for October 21 and Caribou, Maine’s monthly precipitation record for December were statistically almost identical.
Precipitation is increasing at very similar rates regardless of geography because the health of the ether is inexorably improving, and precipitation varies directly with the health of the ether.
In 1995, Caribou, Maine’s monthly precipitation record for December was 5.6 inches of rain and melted snow.
From 1996 to 2011, New Jersey’s annual precipitation record increased by an annual average of .44%.
From 1996 to 2011, New Jersey’s annual precipitation record increased by 6.6%, or by 3.97 inches, from 59.98 inches to 63.95 inches.
In 1996, New Jersey set a new annual precipitation record of 59.98 inches.
From 1997 to 2018, the Los Angeles, California rainfall record for the month of December increased by an annual average of 4.19%.
From 1997 to 2018, the Los Angeles, California rainfall record for the month of December increased by 88%, or by almost two times, or by .89 inches, from 1.01 inches to 1.9 inches.
On December 6, 1997, Los Angeles, California set a monthly rainfall record for December of 1.01 inches.
From 1990 to 2020, the health of the ether in Baltimore, Maryland improved by an annual average of 17.9%, presuming that precipitation varies directly with the health of the ether.
From 1990 to 2020, the .122% average annual increase in annual precipitation in Baltimore, Maryland was 537.5% greater, or well more than six times greater than its .028% average annual decrease from 1870 to 1990.
Given that we’ve learned that precipitation in Baltimore, Maryland decreased by an annual average of .028% from 1870 to 1990, this statistic documents that the health of the ether improved hyper-exponentially from 1990 to 2020.
From 1990 to 2020, the 17.9% average annual increase in the health of the ether was 1,093% greater, or more than eleven times greater than its 1.5% average annual increase from 1950 to 1990.
From 1999 to 2010, the health of the ether in Baltimore, Maryland improved by an annual average of 1%.
From 1999 to 2010, the health of the ether in Baltimore, Maryland improved by 11.3%, presuming that precipitation varies directly with the health of the ether.
From 1999 to 2000, Baltimore, Maryland’s average annual precipitation was 40.8 inches.
From 2000 to 2010, Baltimore, Maryland’s average annual precipitation was 45.4 inches.
From 2000 to 2010, Baltimore, Maryland’s average annual precipitation of 45.4 inches was .4% below the long-term annual average of 45.6 inches from 1871 to 2020.
This refutes the false claim that increasing levels of Carbon Dioxide in the atmosphere are driving a “greenhouse effect” which increases air temperature and rainfall.
From 2000 to 2010, the .003% average annual increase in annual precipitation in Baltimore, Maryland was 96.3% less than its .082% average annual increase from 1870 to 2000.
This refutes the false claim that increasing levels of Carbon Dioxide in the atmosphere are driving a “greenhouse effect” which increases air temperature and rainfall, and documents the poisoning of the ether by what we collectively refer to as “wireless technology”.
From 2010 to 2020, the health of the ether in Baltimore, Maryland improved by an annual average of 4.9%.
From 2010 to 2020, Baltimore, Maryland’s average annual precipitation of 48.7 inches was 6.3% above the long-term average of 45.6 inches from 1871 to 2020.
From 2000 to 2010, Baltimore, Maryland’s average annual precipitation of 45.4 inches was 11.3% greater, or 4.6 inches greater than its 40.8 inches from 1999 to 2000.From 2004 to 2017, snowfall in Baton Rouge, Louisiana increased by an annual average of 7.8%.
From 2004 to 2017, snowfall in Baton Rouge, Louisiana increased by 100%, from .5 inch to 1 inch.
In May 2004, Columbia.edu widened its eyes to simulate honesty and asked “Could Global Warming Mean Less Sunshine and Less Rainfall***?***”
2004 was just a few years after the the literal forest of Death energy infrastructure that many still mistakenly presume only carries cell phone traffic and weather radar data popped up virtually overnight in every city, town and village on Earth.
Just three years later, in 2007, Science asked “How Much More Rain Will Global Warming Bring***?***”
They’re covering their bases in the Punch and Judy tent by affirming that the hedging generality “Global Warming” both decreases and increases rainfall, albeit by unspecified degrees.
In 2007, Science asked “How Much More Rain Will Global Warming Bring***?***”
Just seven years later, in June 2014, the U.K.’s Guardian widened its eyes to simulate honesty and affirmed “Global warming makes drought come on earlier, faster, and harder”.
I have exposed the duplicity of Science and the U.K’s Guardian by using what was known in the old days as “fact checking”.
They’re covering their bases in the Punch and Judy tent by affirming that the hedging generality “Global Warming” both increases and decreases rainfall, albeit by unspecified degrees.
In 2007, Don Croft forwarded me correspondence from a gifter in the Eastern Sierra Nevada mountains, who related that, after being dry for years, Diaz creek, which ran through their property in the Alabama Hills, outside the Eastern Sierra town of Lone Pine, California, was now flowing nicely, and they thought that it was Don’s doing, from his distribution of Orgonite devices along the ridge in the Sierra Nevada that Wilhelm Reich thought to be the lynchpin of the Death energy-based desertification agenda.
Don distributed those TB’s from his ultralight, the “Madame Carol”.
From 2008 to 2017, the respective .74% and .8 average annual increases in Syracuse, New York’s snowfall record for December 13 and the size of the Pennsylvania state record flathead catfish were statistically almost identical.
Snowfall in New York and the size of the flathead catfish in Pennsylvania are increasing at very similar rates because the health of the ether is inexorably improving, precipitation varies directly with the health of the ether, and the size, fertility, longevity and very existence of any organism very directly with the health of its etheric environment.
From 2008 to 2017, Havre, Montana’s October daily snowfall record increased by an annual average of 8%.
From 2008 to 2017, Havre, Montana’s October daily snowfall record increased by 72%, or by almost three fourths, or by 6.2 inches, from 8.6 inches to 14.8 inches.
From 2009 to 2019, Toronto, Canada’s snowfall record for January 29 increased by an annual average of 9.7%.
From 2009 to 2017, the respective 8% and 9.7% average annual increases in Havre, Montana’s October daily snowfall record and Toronto, Canada’s snowfall record for January 29 were statistically similar.
Precipitation is increasing at very similar rates regardless of geography because the health of the ether is inexorably improving, and precipitation varies directly with the health of the ether.
From 2010 to 2020, the .122% average annual increase in annual precipitation in Baltimore, Maryland was 48.7% greater, or nearly half again greater than its .082% average annual increase from 1870 to 2010.
Given that we’ve learned that precipitation in Baltimore, Maryland decreased by an annual average of .028% from 1870 to 1990, this statistic documents that the health of the ether improved very significantly from 2010 to 2020.
From 2010 to 2019, Queensland, Australia’s monthly rainfall record for January increased by an annual average of .8%.
From 2010 to 2019, Queensland, Australia’s monthly rainfall record for January increased by 7.6%, from 774.2 millimeters to 833 millimeters.
From 2010 to 2018, the respective .71% and .8% increases in Caribou, Maine’s monthly precipitation record for December and Queensland, Australia’s monthly rainfall record for January were statistically very similar.
Precipitation is increasing at very similar rates regardless of geography because the health of the ether is inexorably improving, and precipitation varies directly with the health of the ether.
In 2010, Queensland, Australia set a new monthly rainfall record for January of 774.2 millimeters, which was 210% greater ,or more than three times greater than Queensland’s average rainfall of 755.2 millimeters.
From 2011 to 2018, New Jersey’s annual precipitation record increased by an annual average of .13%.
From 2011 to 2018, New Jersey’s annual precipitation record increased by 1.3%, or by .84 inches, from 63.95 inches to 64.79 inches.
In 2011, New Jersey set a new annual precipitation record of 63.95 inches.
From 2012 to 2024, the mean maximum temperature in the Twin Cities of Minneapolis and St. Paul in Minnesota decreased by an annual average of .08%.
From 2012 to 2024, the mean maximum temperature in the Twin Cities of Minneapolis and St. Paul in Minnesota decreased by .835%, or by .5 degree, from 59.9 degrees to 59.4 degrees.
From 2012 to 2020, precipitation in Baltimore, Maryland increased by an annual average of 6.7%.
From 2012 to 2020, precipitation in Baltimore, Maryland increased by 53.5%, or by 20 inches, from 37.4 inches to 57.4 inches.
From 2012 to 2018, 24.2% average annual increase in the health of the ether in Baltimore, Maryland was 396.9% greater, or basically four times greater than its 4.87% average annual increase from 2010 to 2012.
From 2012 to 2018, number of annual rainfall and snowfall days in Baltimore, Maryland increased 145%, or by 86 days, or by almost three months, from 59 to 145.
From 2012 to 2018, the health of the ether in Baltimore, Maryland improved by 145%, presuming that precipitation varies directly with the health of the ether…
From 2012 to 2013, the number of annual rainfall and snowfall days in Baltimore, Maryland increased by 11.8%, or by seven days, from 59 to 66.
In 2012, Baltimore, Maryland had 37.4 inches of precipitation.
In 2012, the number of annual rainfall and snowfall days in Baltimore, Maryland was 59.
In 2012, the mean maximum temperature in the Twin Cities of Minneapolis and St. Paul in Minnesota was 59.9 degrees.
In January 2013, National Geographic said “2012 was the hottest year in U.S. And Yes - It’s Climate Change”.
When, in fact, From 2012 to 2024, the mean maximum temperature in the Twin Cities of Minneapolis and St. Paul in Minnesota decreased by .835%, or by .5 degree, from 59.9 degrees to 59.4 degrees.
I have exposed the duplicity of National Geographic by using what was known in the old days as “fact checking”.
In 2013, the number of annual rainfall and snowfall days in Baltimore, Maryland was 66.
From 2013 to 2014, the number of annual rainfall and snowfall days in Baltimore, Maryland increased by 19.7%, or by 13 days, from 66 to 79.
From 2013 to 2014, the 19.7% increase in the number of annual rainfall and snowfall days in Baltimore, Maryland was 66.9% greater, or two thirds greater than its 11.8% increase from 2012 to 2013.
The great positive change is increasing exponentially, going forward in time, because the health of the ether is inexorably improving, and precipitation varies directly with the health of the ether.
From 2014 to 2019, Chicago, Illinois’ snowfall record for October 31 increased by an annual average of 660%, or by more than seven and a half times.
From 2014 to 2019, Chicago, Illinois’ snowfall record for October 31 increased by 3,300%, or by more than 34 times, from .1 inch to 3.4 inches.
In June 2014, the U.K.’s Guardian widened its eyes to simulate honesty and affirmed “Global warming makes drought come on earlier, faster, and harder”.
When, in fact, just over four years later, In December 2018, mentalfloss.com explained, only-generally, that “Most of the U.S. Is Experiencing Record-Low Drought Levels”.
I have exposed the duplicity of the U.K.’s Guardian by using what was known in the old days as “fact checking”.
In 2014, Chicago, Illinois’ first-ever snowfall record for October 31 was .1 inch. There had never been snow in Chicago on October 31 in history prior to 2014.
In 2014, the number of annual rainfall and snowfall days in Baltimore, Maryland was 79.
From 2014 to 2015, the number of annual rainfall and snowfall days in Baltimore, Maryland increased by 7.6%, or by six days, from 79 to 85.
From 2014 to 2015, the 7.6% increase in the number of annual rainfall and snowfall days in Baltimore, Maryland was 61% less, or nearly two thirds less than its 19.7% increase from 2013 to 2014.
“In 2014, 4G technology, specifically LTE, was significantly expanding and becoming more prevalent worldwide. While the first 4G networks started appearing earlier, 2014 saw a major boost in deployments and user adoption”.
AI Summary
From 2015 to 2016, the number of annual rainfall and snowfall days in Baltimore, Maryland decreased by 15.3%, from 85 to 72.
“In 2015, several wireless technologies experienced significant breakthroughs, including advancements in 5G development”
AI Summary
From 2015 to 2016, the 15.3% decrease in the number of annual rainfall and snowfall days in Baltimore, Maryland was 296.3% greater, or basically four times greater than its 7.9 increase from 2014 to 2015.
This is the signature of the damage done to the ether by the rollout of 5G.
From 2015 to 2016, the 296% negative variance in the increase in the number of rainfall and snowfall days in Baltimore, Maryland versus 2014 to 2015 was 381.3% greater, or nearly five times greater than the 61% negative variance from 2014 to 2015 versus 2013 to 2014.
This is the signature of the damage done to the ether by the rollout of 5G.
From 2016 to 2022, the average temperature in the Twin Cities area of Minnesota decreased by 7.4%, from 49.7 degrees to 46 degrees.
From 2016 to 2018, the average temperature in the Twin Cities area of Minnesota decreased by an annual average of 3.3%.
From 2016 to 2018, the average temperature in the Twin Cities area of Minnesota decreased by 6.6%, from 49.7 degrees to 46.4 degrees.
If carbon-driven increases in temperature are factual, then how could the temperature in Minnesota’s Twin Cities area decrease by 6.6 degrees from 2016 to 2018?
Carbon-driven increases in temperature via “the greenhouse effect” are a false construct.
false construct - (philosophy) - a flawed idea or belief that is based on incorrect or misleading reasoning, often used to simplify complex issues. It’s a concept that is not grounded in reality or accurate information. Essentially, it’s a fabricated or misleading idea presented as truth.
From 2016 to 2018, Minnesota’s annual precipitation record increased by 7%, or by 3.97 inches, from 56.24 inches to 60.21 inches.
From 2016 to 2018, the 6.6% decrease in the average temperature in the Twin Cities area of Minnesota and the 7% increase in Minnesota’s annual precipitation record were statistically almost identical.
The decrease in temperature and the increase in precipitation are nearly identical because air temperature and precipitation vary directly with the health of the ether.
From 2016 to 2018, the 3.3% average annual decrease in the average temperature in the Twin Cities area of Minnesota was 3,502% greater, or more than thirty six times greater than its .097% average annual increase from 1911 to 2016.
From 2016 to 2018, the 3.5% average annual increase in Minnesota’s annual precipitation record was 1,650% greater, or more than seventeen times greater than its .2% average annual increase from 1991 to 2016.
The great positive change is increasing hyper-exponentially, going forward in time, because the health of the ether is inexorably improving, and precipitation varies directly with the health of the ether.
In 2016, Flagstaff, Arizona’s set a new daily snowfall record of 10.1 inches.
From 2016 to 2017, the 68% increase in the number of annual rainfall and snowfall days in Baltimore, Maryland was 544% greater, or almost six and a half times greater(?) than its 15.3% decrease from 2015 to 2016.
From 2016 to 2017, the 68% increase in the number of annual rainfall and snowfall days in Baltimore, Maryland was 794.7% greater, or basically nine times greater than its 7.6% increase from 2014 to 2015.
In 2016-17, Boise, Idaho set a new snowfall record for December and January of 35.5 inches.
In 2016, the average temperature in the Twin Cities area of Minnesota was 49.7 degrees.
In 2016-17, Bismarck, North Dakota set a new snowfall record through January 2 of 53.1 inches.
In 2016, Minnesota set a new annual precipitation record of 56.24 inches.
In 2016, the number of annual rainfall and snowfall days in Baltimore, Maryland was 72.
In 2016-17 average precipitation of rain and melted snow at the Sugar Bowl Ski area totaled 89.7 inches, the most in history.
In 2016-17, 751 inches of snow fell on the Sugar Bowl ski area near Lake Tahoe, the most in history.
In 2016-17, total precipitation in California’s Sacramento, Feather and American river basins was the greatest on record, from 1921 to present.
From 2016 to 2017, the back of the great Death energy-based system was broken.
From 2016 to 2017, the average temperature in the Twin Cities area of Minnesota decreased by 2.4%, from 49.7 degrees to 48.5 degrees.
In 2016, Minnesota’s new annual precipitation record of 56.24 inches was 5% greater, or 2.72 inches greater than the previous record of 53.52 inches set in 1991.
In 2016-17, the California water year record was 8% greater than the previous record from 1982-83.
In 2016-17, the Boise, Idaho snowfall record for December and January of 35.5 inches was 16% greater, or nearly one fifth greater, or five inches greater than the previous record of 30.5 inches set in 1983-34.
The Idaho Statesman omitted the percentage increase, and describe it with the hedging generality “handily surpassed the previous record”.
That is an example of the propaganda technique known as “stonewalling”.
From 2016 to 2017, the number of annual rainfall and snowfall days in Baltimore, Maryland increased by 68%, or by basically two thirds, or by 49 days, from 72 to 121.
In 2016-17, overall precipitation in the Northern Sierras in California was 200 percent of average, or two times average.
In 2016, Flagstaff, Arizona’s new daily snowfall record of 10.1 inches was 146% greater, or by basically one and a half times greater than the previous record of 4.1 inches set in 1916.
From October 2016 to February 2017, the increase in the water level of Lake Tahoe was “greater” than the same time period in the previous nine years.
From 2016 to 2017, the 500% increase in the average number of structures destroyed per brushfire in California was 1,415% greater , or more than fifteen times greater than the 33% increase in brush fires in California during the same time period.
This documents the criminality of generational Satanist Freemason arsonists and firefighters in California.
In December 2016 and January 2017, Boise, Idaho set an all time record for snowfall of 35.5 inches, which was 16% greater than the previous record of 30.5 inches in December and January 1983-4
The uncredited author from the Idaho Statesman omitted the percentage increase, and replaced it with the hedging generality “handily surpassed”.
Those are examples of the propaganda technique known as “stonewalling”.
In March 2017, the Idaho Statesman said “Boise’s winter weather breaks some records, falls short on others”.
Where the specific “snow” has been walked back to the general “winter weather”, and where “breaks”, “some records”, falls short” and “others” are all hedging generalities.
The author tacked “falls short on others” on the end of the headline to give the misleading impression that it was “an up and down snowfall winter”.
Those are examples of the propaganda technique known as “stonewalling”.
On June 28, 2016, an uncredited author from kcalnews.com said “Record Number Of Rattlesnakes Making Their Way Into Yards Due To Drought”.
When, in fact, in 2016-17, total precipitation in California’s Sacramento, Feather and American river basins was the highest on record, from 1921 to present.
drought - noun - a prolonged period of abnormally low rainfall, leading to a shortage of water.
The most rainfall in history cannot in good faith be described as a prolonged period of abnormally low rainfall.
I have exposed the duplicity of kcalnews.com by using what was known in the old days as “fact checking”.
For those unaware, anytime an author is uncredited, it is proof that said author is an Intelligence operative.
On December 19, 2016, an article that I can no longer locate said, only-generally, “Record Rainfall and Flooding in Southern Thailand”.From 2017 to 2019, the February snow record at Squaw Valley (now Palisades Tahoe) increased by an annual average of 30.4%.
From 2017 to 2019, the February snow record at Squaw Valley (now Palisades Tahoe) increased by 60.7%, from 196 inches to 315 inches.
From 2017 to 2019, the 30.4% average annual increase in the February snow record at Squaw Valley (now Palisades Tahoe) was 2,663.3% greater, or more than twenty seven times greater than the 1.1% average annual increase in the January snow record at Squaw Valley (now Palisades Tahoe).
This documents a gigantic, hyper-exponential increase in the health of the ether, which got underway in earnest in 2017.
In January 2017, newsmax.com’s Michael Reagan said “Climate Alarmists Will Miss California’s Drought”.
In January 2017, the water content of the snowpack in California was 135 percent of average, or 35% average, or more than one third above average.
In January 2017, rainfall for Northern California was just over 200 percent of average, or two times average, per the California Department of Water Resources.
In January 2017, Squaw Valley’s Donner Summit Snow Lab (elevation 7,000 feet) reported a record January with 237 inches of snow, which was 49% greater, or half again greater, or 78 inches greater than the previous January record of 159 inches set in 1973.
The uncredited “Rob” of skiing-blog.com omitted the percentage increase, and replaced it with the hedging generality “soundly beating the previous January record”.
That is an example of the propaganda technique known as “stonewalling”.
On January 8, 2017, an article that I can no longer locate said, only-generally “Thailand floods: 12 dead as record rainfall persists”.
On January 11, 2017, Tara Lohan of the psychotically named “New Humanitarian” explained “Why Record Precipitation May Not Be a Cure-All for California Water Shortage”.
Grade school children studying the subject in the future will marvel that any person could conceive that record rainfall would not be a cure-all for a water shortage.
But, as a propagandist, Tara Lohan knows that many or most readers will grasp virtually any straw, no matter how thin, to remain off the hook of personal responsibility.
Here’s Tara Lohan’s picture, in a Satanic purple jacket, against a Satanic green Kabbalist “Tree of Life” background.

(Tara Lohan, Managing Editor of Water Deeply)
I have included the she-man Tara Lohan’s picture so that you could get a better idea of what generational Satanist Freemason of marginal influence looks like.
They are all related to one another through the maternal bloodline. Generational Satanists comprise between twenty and thirty percent of the populace, and are hiding in plain sight in every city, town and village on Earth.
It’s how the few have controlled the many all the way back to Babylon, and before.
But they say that the hardest part of solving a problem is recognizing that you have one.
Don Croft used to say “Parasites fear exposure above all else”.
How long do you think that these people have left in power, now?
Please consider doing what you can to help speed the transition.
In February 2017, fighting a brave but desperate and ultimately hopeless rearguard action, an uncredited author from ABC News said “California’s wet weather has some believing the drought is over”.
Where “record rainfall” has been walked back to “wet weather”.
When, in fact, n 2016-17, total precipitation in California’s Sacramento, Feather and American river basins was the greatest on record, from 1921 to present.
I have exposed the duplicity of ABC News by using what was known in the old days as “fact checking”.
For those unaware, anytime an author is uncredited, it is proof that said author is an Intelligence operative.
In February 2017, fighting a brave but desperate and ultimately hopeless rearguard action, the Christian Science Monitor said “As the snowpack piles up, is California’s drought over? No, say experts.
When, in fact, an eight-station average of precipitation totals in the Sierra Nevada during the 2016-2017 season was the greatest ever, in all history, 8% above the previous record.
I have exposed the duplicity of the Christian Science Monitor by using what was known in the old days as “fact checking”.
In February 2017, Squaw Valley (now Palisades Tahoe) had the snowiest February in history, at 196 inches.
In March 2017, California had record precipitation and snowpack.
In April 2017, USA Today said, only-generally, “U.S. drought reaches record low as rain reigns”.
Then, just one month later, in May 2017, epa.gov wondered “Can global warming reduce rainfall in the world?”
Then, just over a year later, in November 2018, Nature explained “Why extreme rains are gaining strength as the climate warms.”
They’re covering their bases in the Punch and Judy tent by affirming that the hedging generalities “global warming” and “as the climate warm” both decrease and increase rainfall, albeit to unspecified degrees.
In April 2017, trying to get his street-cred back, Controlled-Opposition mouthpiece wattsupwiththat.com’s Anthony Watts questioned “What “permanent drought”? New all-time rainfall record set for California”.
Where Anthony did what little he could to hedge by using “permanent drought” in the headline, to get it out there as a thought-form.
In April 2017, Controlled-Opposition mouthpiece Wired’s Nick Stockton said that “California Overcame 1/100 Odds to Beat Its Epic Drought”.
Where, with “epic drought”, Nick deviantly channels “Fast Times at Ridgemont High’s” Jeff Spicily and spins California’s drought into a positive.

(Sean Penn as Jeff Spicoli in “Fast Times At Ridgemont High”, 1982)
On April 7, 2017, the U.K.’s Guardian wagged its bony finger and warned “The California drought is officially over, but the next could be around the corner”.
On April 7, 2017 Governor Jerry Brown declared California’s drought emergency over “for now”.
On April 8, 2017, Mother Jones’ Tom Philpott wagged his bony finger and warned “California’s drought is over, but the Rest of the World’s Water Problems are Just Beginning”.
Fortunately for us, we’re in the midst of a scholarly discussion on the subject, and the misdirection feint of “the World’s Water Problems are Just Beginning” appears particularly ridiculous. Vis a vis, on October 2, 2017, Curtin Springs, Australia had its highest September daily rainfall on record.
I have exposed the duplicity of Tom Philpott and Mother Jones by using what was known in the old days as “fact checking”.
Here’s a picture of Tom, in a Satanic purple shirt, against a Satanic green Kabbalist “Tree of Life” background, and where the image is blatantly constructed to focus attention on his left eye.

(Mother Jones’ Tom Philpott)
The image features his left eye because, to bloodline-linked Illuminists like Tom, the left eye is the “eye of Will” or the “eye of Horus”.
‘The right eye is the Eye of Ra and the left is the Eye of Horus’.”
From “Freemasonry - Religion And Belief - The 3rd Temple”
Facebook: “Welcome to the Left-Hand-Path-Network, where Satanism is not about worship, but it’s study.”
I have included this picture of Tom Philpott so that you could get a better idea of what generational Satanist Freemason of marginal influence looks like.
They are all related to one another through the maternal bloodline. Generational Satanists comprise between twenty and thirty percent of the populace, and are hiding in plain sight in every city, town and village on Earth.
It’s how the few have controlled the many all the way back to Babylon, and before.
But they say that the hardest part of solving a problem is recognizing that you have one.
Don Croft used to say “Parasites fear exposure above all else”.
On April 9, 2017 the U.C. Davis Center For Watershed Science’s californiawaterblog.com’s Jay Lund threw down the Black magic mind-fuck of “California’s drought and floods are over and just beginning”.
Here’s Jay Lund’s picture, using a purportedly-secret Masonic “gesture of recognition”, and where the image is constructed to focus attention on his left eye.

(Jay Lund, Vice Director, U.C. Davis Center For Watershed Science)
Now, for any Coincidence Theorists lingering in the readership, here is a 19th Century depiction of a Freemason using the same purportedly-secret Masonic “gesture of recognition” that Jay Lund is in the photo immediately above.

(19th Century depiction of a Freemason using a purportedly-secret Masonic “gesture of recognition”.)
The image features his left eye because, to bloodline-linked Illuminists like Jay, the left eye is the “eye of Will” or the “eye of Horus”.
‘The right eye is the Eye of Ra and the left is the Eye of Horus’.”
From “Freemasonry - Religion And Belief - The 3rd Temple”
Facebook: “Welcome to the Left-Hand-Path-Network, where Satanism is not about worship, but it’s study.”
I have included this picture of U.C. Davis’ Jay Lund so that you could get a better idea of what generational Satanist Freemason of marginal influence looks like.
They are all related to one another through the maternal bloodline. Generational Satanists comprise between twenty and thirty percent of the populace, and are hiding in plain sight in every city, town and village on Earth.
It’s how the few have controlled the many all the way back to Babylon, and before.
But they say that the hardest part of solving a problem is recognizing that you have one.
Don Croft used to say “Parasites fear exposure above all else”.
On April 13, 2017, the Washington Post’s Jason Samenow said “After 63 feet of snow, Northern California mountains break record for wettest water year”.
Where Jason omitted the statistic, replaced it with the hedging generalities “break”, and “wettest”, and walked “annual rainfall record” back to “wettest water year”.
Those are all examples of the propaganda technique known as “stonewalling”.
Here’s Jason Samenow’s picture, in a Satanic purple shirt, and where he’s using a purportedly-secret Masonic “gesture of recognition”.

(The Washington Post’s Jason Samenow)
For any Coincidence Theorists lingering in the readership, here’s are a couple of 19th Century depiction of a Freemason using the same purportedly-secret crossed-arms “gesture of recognition” that the Washington Post’s Jason Samenow is in the photo immediately above.

(19th Century depiction of a Freemason using the purportedly-secret crossed-arms “gesture of recognition”.)
I have included this picture of Jason Samenow so that you could get a better idea of what generational Satanist Freemason of marginal influence looks like.
They are all related to one another through the maternal bloodline. Generational Satanists comprise between twenty and thirty percent of the populace, and are hiding in plain sight in every city, town and village on Earth.
It’s how the few have controlled the many all the way back to Babylon, and before.
But they say that the hardest part of solving a problem is recognizing that you have one.
Don Croft used to say “Parasites fear exposure above all else”.
On April 13, 2017, the LA Times’ Sarah Parvini said “Northern California gets its wettest winter in nearly a century”.
Where the hedging generality “nearly a century” mitigates, and obscures “wettest in history”.
On May 29, 2017, in the midst of a completely-transformed environment and record rainfall, an uncredited article from humanitarian.org humanitarian.org article “California’s drought is all but over, but some wells are still dry.”
On July 6, 2017, an article from the Orwellian watereduction.org by Mark Grossi explained “The California Drought Isn’t Over, It Just Went Underground.”
Where “it just went underground” is an example of the Punch and Judy tent school of faux-science that is still practiced here in the very late Middle Ages. Other recent examples include “Rex block” and “bomb cyclone”.
Here’s a picture of Mark Grossi, where he’s using a purportedly-secret Masonic “gesture of recognition”.
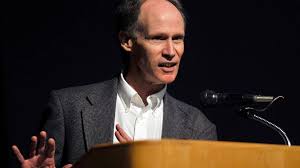
(Mark Grossi)
Now, for any Coincidence Theorists lingering in the readership, here’s a 19th Century depiction of a Freemason using the same purportedly-secret “gesture of recognition” that Mark Grossi is in the photo immediately above.
(19th Century depiction of a Freemason using the same purportedly-secret “gesture of recognition)
I have included Mark Grossi’s picture so that you could get a better idea of what generational Satanist Freemason of marginal influence looks like.
They are all related to one another through the maternal bloodline. Generational Satanists comprise between twenty and thirty percent of the populace, and are hiding in plain sight in every city, town and village on Earth.
It’s how the few have controlled the many all the way back to Babylon, and before.
But they say that the hardest part of solving a problem is recognizing that you have one.
Don Croft used to say “Parasites fear exposure above all else”.
On October 2, 2017, Curtin Springs, Australia had its highest September daily rainfall on record on October 2, 2017.
An article that I can no longer locate described with the hedging generalities “record rainfall” and “a summer’s worth of rain”, and omitted the specific amount of rainfall, the margin between the old record and the new, what the old record was, and when the old record was set.
Those are all examples of the propaganda technique known as “stonewalling”.
In December 2017, Scientific American widened it’s eyes to simulate honesty and averred “Scientists Link Hurricane Harvey’s Record Rainfall to Climate Change”.
Where the hedging generalities “scientists”, “record rainfall” and “climate change” are put forward to obscure the fact that precipitation varies directly with the health of the ether.
In December 2017, The Tribune said “Mild La Niña creating drought conditions in California”.
Where La Nina, a quasi-mythical patch of slightly warmer than normal water in the vastness of the Pacific Ocean is falsely purported to be the driver of a drought that was not, in fact taking place.
In December 2017, the State propaganda outlet “The Verge” hissed “California will burn until it rains, climate change may keep rains away”.
Where the headline ignores the fact that 2016-17 was the wettest year in California’s history, and where the general “will burn until it rains” refers to the purportedly “wild” fires being serially set by generational Satanist Freemasons arsonists and firefighters in California.
Ergo, from 2016 to 2017, the 500% increase in the average number of structures destroyed per brushfire in California was 1,415% greater , or more than fifteen times greater than the 33% increase in brush fires in California during the same time period.
This documents the criminality of generational Satanist Freemason arsonists and firefighters in California.
In December 2017, at the tail end of the wettest year in the history of the state of California, the Mercury News asked duplicitously “Is California heading back into a drought?”
On December 7, 2017, the Watchers News’ Teo Blašković said “Alaska records one of the most extreme snowfall rates on record”.
Where “record snowfall” has been walked back to “one of the most extreme snowfall rates on record”.
Diabolically, the word “records” triggers the subconscious of the Coincidence Theorist reader to say “oh, but someone must have recorded that incorrectly!”
And where “on record” provides the suggestion that many more, er, extreme snowfall rates had taken place, only nobody had recorded them with the proper skill or assiduousness, previously.
As a propagandist, Teo knows that many or most readers will grasp virtually any straw, no matter how thin, to remain off the hook of personal responsibility.
Here’s a picture of Teo Blaskovic, in a Satanic purple jacket and fleece, with a Satanic green Starbuck’s logo featuring the she-demon Melusine in the foreground.

(Teo Blaskovic)
I have included Teo’s picture so that you could get a better idea of what generational Satanist Freemason of marginal influence looks like.
They are all related to one another through the maternal bloodline. Generational Satanists comprise between twenty and thirty percent of the populace, and are hiding in plain sight in every city, town and village on Earth.
It’s how the few have controlled the many all the way back to Babylon, and before.
But they say that the hardest part of solving a problem is recognizing that you have one.
Don Croft used to say “Parasites fear exposure above all else”.
How long do you think that these people have left in power, now?
Please consider doing what you can to help speed the transition.
In 2017, Baltimore, Maryland had an average of .31 inch of precipitation per precipitation day.
In 2017, Portland, Oregon set a new daily rainfall record for October 21 of 1.11 inches
In 2017, Amarillo, Texas set a new daily rainfall record for August 9 of 2.41 inches.
In 2017, Oklahoma City, Oklahoma set a new daily rainfall record for October 4 of 2.79 inches.
In February 2017, Lake Tahoe was within 3 feet of the legal limit.
In 2017, Philadelphia, Pennsylvania set a new daily snowfall record for December 9 of 3.3 inches.
In 2017, Colorado Springs, Colorado set a new July snowfall record of 6.56 inches.
In 2017, Syracuse, New York set a new daily snowfall record for December 13 of 8.9 inches.
In 2017, Ottawa, Canada set a new daily snowfall record for February 12 of 28 centimeters, or 11 inches.
In 2017, Ottawa, Canada set a new daily snowfall record for February 6 of 20.2 inches, or 51.2 centimeters.
In 2017, the average temperature in the Twin Cities area of Minnesota was 48.5 degrees.
In 2017, the number of annual rainfall and snowfall days in Baltimore, Maryland was 121.
In 2017, Portland, Oregon’s new daily rainfall record for October 21 of 1.11 inches was .9% greater than the previous record of 1.10 inches set in 1951.
From 2017 to 2018, the average temperature in the Twin Cities area of Minnesota decreased by 4.3%, from 48.5 degrees to 46.4 degrees.
In 2017, Philadelphia, Pennsylvania’s new daily snowfall record for December 9 of 3.3 inches was 13.8% greater, or .4 inches greater than the previous record of 2.9 inches set on December 9, 1942.
In 2017, Ottawa, Canada’s new daily snowfall record for February 12 of 28 centimeters was 14.8% greater than the previous record of 24.4 centimeters set on February 12, 1988.
1310 News provided the old and new records, but carefully withheld the percentage increase between them, saying only that the new record “broke” the old.
That is an example of the propaganda technique known as “stonewalling”.
From 2017 to 2018, the number of annual rainfall and snowfall days in Baltimore, Maryland increased by 19.8%, or by 24 days, from 121 to 145.
In 2017, Colorado Springs, Colorado’s new July snowfall record of 6.56 inches was 24.5% greater, or one fourth greater, or 1.29 inches greater than the previous record of 5.27 set in 1968.
In 2017, the new Oklahoma City, Oklahoma daily rainfall record for October 4 of 2.79 inches was 25.7% greater, or .57 inches greater than the previous record of 2.22 inches set on October 4, 1955.
In 2017, the respective 24.5% and 25.7% margins between Colorado Springs, Colorado’s July snowfall records and Oklahoma City, Oklahoma’s daily rainfall records for October 4 were statistically almost identical.
The increases in precipitation are nearly identical because air precipitation vary directly with the health of the ether.
In 2017, the respective 25.7% and 26.10% margins of the new Oklahoma City, Oklahoma daily rainfall record for October 4 and the new Ottawa, Canada daily snowfall record for February 6 were statistically almost identical.
Precipitation is increasing at very similar rates regardless of geography because the health of the ether is inexorably improving, and precipitation varies directly with the health of the ether.
In 2017, the new Ottawa, Canada daily snowfall record for February 6 of 51.2 centimeters was 26.10% greater, or more than one fourth greater, or 9.6 centimeters greater than the previous record of 40.6 centimeters set on February 6, 1947.
CBS Canada provided the old and new records, but carefully withheld the percentage increase between them, saying only the the new record “broke” the old.
That is an example of the propaganda technique known as “stonewalling”.
In 2017, the respective 24.5% and 26.1% margins of the new Colorado Springs, Colorado July snowfall record and the new Ottawa, Canada daily snowfall record for February 6 were statistically very similar.
Precipitation is increasing at very similar rates regardless of geography because the health of the ether is inexorably improving, and precipitation varies directly with the health of the ether.
In 2017, Amarillo, Texas’ new daily rainfall record for August 9 of 2.41 inches was 42.6% greater than the previous record of 1.69 inches set on August 9, 1939.
On December 15, 2017, Spokane, Washington’s snowfall record for the date of 7.1 inches was 48% greater, or basically half again greater, or 2.3 inches greater than the previous record of 4.8 inches set on December 15, 1963.
Spokane’s The Spokesman omitted the percentage increase, and described it with the hedging generalities “breaks daily record” and “crushing the record”.
Those are examples of the propaganda technique known as “stonewalling”.
On December 13, 2017, Syracuse, New York’s snowfall record for the date of 8.8 inches was 49.1% greater, or basically half again greater, or 2.9 inches greater than the previous record of 5.9 inches set on December 13, 1951.
Syracuse.com said in comment “Syracuse breaks snowfall record - and it wasn’t even the snowiest spot in CNY”
The subhead goes on to say “Wednesday’s snowfall in Central New York was record-breaking.”
Where “breaks” and “breaking” are hedging generalities, put forward to blunt any specific insight into the magnitude of the increase.
And where “it wasn’t even the snowiest spot in CNY” hedges once again.
In December 2017, the 48% increase in Spokane, Washington’s snowfall record for December 15 and the 49.1% increase in Syracuse, New York’s snowfall record for December 13 were statistically almost identical.
Snowfall levels are increasing at very similar rates regardless of geography because the health of the ether is inexorably improving, and precipitation varies directly with the health of the ether.
In 2017, Havre, Montana’s new October daily snowfall record of 14.8 inches was 72% greater, or almost three fourths greater, or 6.2 inches greater than the previous record of 8.6 inches set in 2008.
From 2017 to 2018, the 4.3% decrease in the average temperature in the Twin Cities area of Minnesota was 79.2% greater, or more than three fourths greater than its 2.4% decrease from 2016 to 2017.
The temperature in the Twin Cities area of Minnesota is decreasing exponentially, going forward in time.
That’s because the health of the ether is inexorably improving, and air temperature varies directly with the health of the ether.
On December 8, 2017, one inch of snow fell on Baton Rouge, Louisiana, which was 100% greater or two times greater than the .5 inch of snow that had last fallen there in 2004.
An uncredited author from theadvocate.com described it as “Snow in Baton Rouge: A rare December day for wintry precipitation in South Louisiana”.
On January 12, 2017, California’s Nicasio Reservoir was at 100% of capacity.
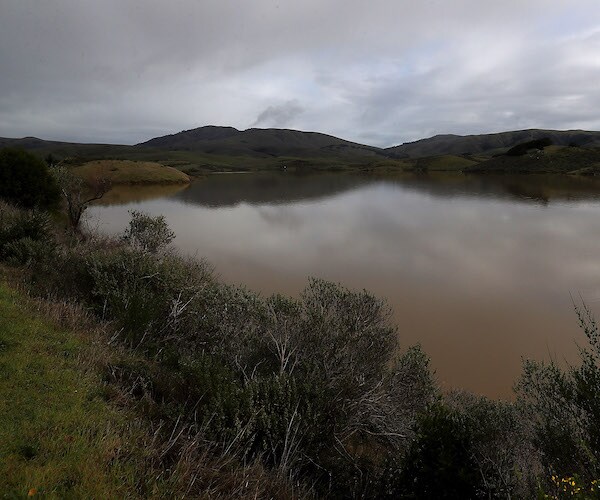
(California’s Nicasio Reservoir at 100% of capacity, January 2017)
From 2018 to 2022, the average temperature in the Twin Cities area of Minnesota decreased by .862%, from 46.4 degrees to 46 degrees.
In December 2018, Los Angeles, California set a monthly rainfall record for December of 1.9 inches.
In January 2018, watoday said “Summer rain smashes Perth weather records with wettest January in history”.
Where Western Australia Today used the hedging generalities “smashes” and “wettest” and omitted the specific amount of rainfall, the margin between the old record and the new, what the old record was, and when the old record was set.
Those are all examples of the propaganda technique known as “stonewalling”.
In January 2018, the East Bay Times said “California storm sets rainfall records, triggers trouble in fire zones”.
Where “triggers trouble in fire zones” is Mil-speak for “impacted the ability of generational Satanist arsonists to set purportedly “wild” fires.
To name only one example of many, from 2018 to 2019, the 1,650% (average) increase in the average number of structures destroyed per brush fire in California was 154% greater, or more than one and a half times greater than its 649.5% average annual increase 2016 to 2018.
This documents the criminality of generational Satanist Freemason arsonists and firefighters in California.
In January 2018, pretending to be thorough journalistic, KCRA said “Many areas across NorCal break rainfall records”.
Where Northern California has been walked back to “NorCal”, and where “many”, “areas”, “across”, “NorCal”, “break” and “rainfall records” are all hedging generalities.
Those are all examples of the propaganda technique known as “stonewalling”.
In February 2018, USA Today wrung its hands and assured “Drought in United States at worst level in nearly four years”.
When, in fact, just ten months later, in December 2018, mentalfloss.com would explain (only-generally) that “Most of the U.S. Is Experiencing Record-Low Drought Levels”.
USA Today is making up climate hysteria out of whole cloth, by using hedging generalities like “worst level” and “in nearly four years”.
I have exposed their duplicity by using their own publication for what was known in the old days as “fact checking”.
In May 2018, carbonbrief.org assured “Climate change is already making droughts worse”.
When, in fact, just seven months later, in December 2018, mentalfloss.com explained (only-generally) that “Most of the U.S. Is Experiencing Record-Low Drought Levels”.
They’re using the hedging generalities “climate change” and “already making droughts worse” to make up climate hysteria out of whole cloth.
I have exposed the duplicity of carbonbrief.org by using what was known in the old days as “fact checking”.
On July 11, 2018, an article that I can no longer located questioned, only-generally, “Does Climate Change Have Anything to Do With Floods in Thailand?”
Where “record rainfall” has been carefully walked back to the lurid but general “floods”.
In November 2018, just six months after USA today assured, only-generally, “Drought in United States at worst level in nearly four years”, Nature explained “Why extreme rains are gaining strength as the climate warms.”
In December 2018, mentalfloss.com explained (only-generally) that “Most of the U.S. Is Experiencing Record-Low Drought Levels”.
In 2018, Baltimore, Maryland had an average of .49 inch of precipitation per precipitation day.
In 2018 New Jersey set a new annual precipitation record of 64.79 inches.
In 2018, the average number of structures destroyed per brush fire in California was 2.8, or 22,226 structures destroyed in 7,948 fires.
In 2018, Tampa Bay, Florida set a new daily rainfall record of 3.31 inches.
In 2018, Caribou, Maine’s monthly precipitation record for December was 5.64 inches of rain and melted snow.
In 2018, North Carolina set a daily snowfall record for January 16 at North Carolina’s Raleigh-Durham University of 5.9 inches.
In 2018, Grand Island, Michigan set a new daily snowfall record of 7.4 inches.
In 2018, Central Oregon set a new snowfall record for the month of January, at 24 inches.
In 2018, the average temperature in the Twin Cities area of Minnesota was 46.4 degrees.
In 2018, Minnesota set a new annual precipitation record of 60.21 inches.
In 2018, the number of annual rainfall and snowfall days in Baltimore, Maryland was 145.
In 2018, the average number of acres burned per brush fire in California was 248.5.
In 2018, there were 7,948 brush fires in California.
In 2018, 24,226 structures were destroyed by brush fires in California.
In 2018, there were 1,975,086 acres burned by brush fires in California.
In 2018, Caribou, Maine’s monthly precipitation record for December of 5.64 inches of rain and melted snow was .71% greater than the previous record of 5.6 inches in 1995.
In 2018, Minnesota’s new annual precipitation record of 60.21 inches was 7% greater, or 3.97 inches greater than the previous record of 56.24 inches set in 2016.
Kenny Blumenfeld, a senior climatologist with the Minnesota state Department of Natural Resources, said “In climate terms, breaking a precipitation record by nearly 4 inches is a little absurd.”
Where “absurd” is a hedging generality, and “a little” hedges against “absurd”.
Here’s Kenny’s picture, against a Satanic green and purple background, where the image is constructed to focus attention on his left eye, and where he’s using a purportedly-secret Masonic “gesture of recognition”:

(Kenny Blumenfeld, Senior Climatologist, Minnesota Department of Natural Resources)
Now, for any Coincidence Theorists lingering in the readership, here is an image of George Lucas’ Star Wars character Jar Jar Binks, using the same purportedly-secret Masonic “gesture of recognition” that Senior Climatologist Kenny Blumenfeld is in the photo immediately above.

(“Jar Jar Binks”, from “Star Wars Episode I: The Phantom Menace”, 1999)
In addition to being a cruel racial stereotype of a shuffling, thick-lipped, dreadlocked Stepin Fetchit negro, Jar Jar Binks is a simulacra of the great god Set whom literally blood-drinking Illuminists like George Lucas have worshipped all the back to Egypt, and before.

(Jar Jar Binks)

(The Egyptian God Set)
Steppin Fetchit - In the early 1900’s, Lincoln Perry portrayed a character known as Stepin Fetchit, criticized for embodying the “coon” caricature, a racist stereotype depicting Black men as lazy, unintelligent, and buffoonish.
Here’s a picture of Set striding like Jar Jar is in the photo above which we reviewed previously.

(The Egyptian god Set)
George Lucas hid Set behind this cruel racial stereotype because he understands that the key to any successful Confidence game is misdirection.
The image of Kenny Blumenfeld features his left eye because, to bloodline-linked Illuminists, the left eye is the “eye of Will” or the “eye of Horus”.
‘The right eye is the Eye of Ra and the left is the Eye of Horus’.”
From “Freemasonry - Religion And Belief - The 3rd Temple”
Facebook: “Welcome to the Left-Hand-Path-Network, where Satanism is not about worship, but it’s study.”
I have included Kenny Blumenfeld’s picture so that you could get a better idea of what generational Satanist Freemason of marginal influence looks like.
They are all related to one another through the maternal bloodline. Generational Satanists comprise between twenty and thirty percent of the populace, and are hiding in plain sight in every city, town and village on Earth.
It’s how the few have controlled the many all the way back to Babylon, and before.
But they say that the hardest part of solving a problem is recognizing that you have one.
Don Croft used to say “Parasites fear exposure above all else”.
How long do you think that these people have left in power, now?
Please consider doing what you can to help speed the transition.
In 2018, New Jersey’s new annual precipitation record of 64.79 inches was 1.3% greater, or .84 inches greater than the previous record of 63.95 inches from 2011.
In 2018, the 89% increase in Yankton, South Dakota’s daily snowfall record for January 21 was 23.6% greater, or almost one fourth greater than the 72% increase in Havre, Montana’s October daily snowfall record in 2017.
The great positive change is increasing exponentially, going forward in time, because the health of the ether is inexorably improving, and precipitation varies directly with the health of the ether.
In 2018, the North Carolina daily snowfall record for January 16 at North Carolina’s Raleigh-Durham University of 5.9 inches was 47% greater, or basically half again greater, or 5.9 inches greater than the previous record of 4 inches set in 1946.
In 2018, Yankton, South Dakota’s daily snowfall record for January 21 increased by 89%, or by nearly two times.
In 2018, Tampa Bay, Florida’s new daily rainfall record of 3.31 inches was 117.8% greater or more than two times greater than the previous record of 1.52 inches from 1900.
In 2018, Grand Island, Michigan’s new daily snowfall record of 7.4 inches was 146% greater, or 4.4 inches greater, or basically one and a half times greater than the previous record of 3 inches from 1915.
From 2018 to 2019, the 1,650% (average) increase in the average number of structures destroyed per brush fire in California was 154% greater, or more than one and a half times greater than its 649.5% average annual increase 2016 to 2018.
This documents the criminality of generational Satanist Freemason arsonists and firefighters in California.
From 2018 to 2019, the 11.2% increase in acres burned per brush fire in California was 212% greater, or more than three times greater than the 10% decrease in brush fires there during the same time period.
Here we have a sudden, exponential decrease in the effectiveness of firefighters, which documents the criminality of generational Satanist Freemason firefighters in California.
From 2018 to 2019, the average number of structures destroyed per brush fire in California increased by 260.7%, or by more than three and half times, from 2.8 to 10.1.
Here we have a sudden, hyper-exponential increase in structures destroyed by brush fire in California, which documents the criminality of generational Satanist Freemason arsonists and firefighters in California.
From 2018 to 2019, winter rainfall in Los Angeles increased by 603% (verify).
On January 8, 2019, an article which I can no longer locate said “Southeast Asia records unusual January rain”.
Where “Thailand” has been walked back to “Southeast Asia”, where “record” has been walked back to “unusual”, and where “rainfall” has been walked back to “rain”.
The author said “records” to give the subconscious of the Coincidence Theorist reader the green light to say “oh, but someone must have recorded that incorrectly!”
The propagandist knows that many or most readers will grasp virtually any straw, no matter how thin, to remain off the hook of personal responsibility.
On August 5, 2019, an uncredited author from the Mekong River Commission published “Weekly Flood Situation Report for the Mekong River Basin.
Where “record rainfall” has been walked back to “flood situation”, and where “Thailand” has been walked back to “Mekong River Basin”.
On September 10, 2019, an uncredited author from fitchsolutions.com said “Thailand’s Rice Production To Remain Elevated Despite Drought”.
Where “record rice production” was walked back to “rice production to remain elevated”.
When, in fact, just a month earlier, on August 5, 2019, an uncredited article from the Mekong River Commission published “Weekly Flood Situation Report for the Mekong River Basin.
Weekly flooding on the Mekong River in August 2019 proves that Fitch Solutions’ statement that Thailand was experiencing drought in September 2019 is false.
I have exposed the duplicity of Fitch Solutions by using what was known in the old days as “fact checking”.
On October 7, 2019, khaosodenglish.com’s Staff Reporter Asaree Thaitrakulpanich said “Most provinces in Thailand will continue to see rain throughout the week until lower temperatures signal a transition from the rainy season to the cold season”.
In December 2019, voanews.com said “Mekong River’s new aquamarine color may be sign of trouble”.
Where the propagandist has deviously turned an increase in clarity into a change in color, and threatened in a completely general way that it couldn’t be anything good.
That is an example of what is known as “Black magic”.
It is an example of what I’ve dubbed a Satanic Inversion, and which George Orwell called, variously, “Doublespeak” and “Doublethink”.

(Mekong river suddenly goes clear and turns blue, Thailand, December 2019)

(The Mekong River suddenly goes clear, turns blue, then is artificially lowered, Thailand, December 2019)
The article goes on to say “experts say the decline in sediment exposes a different danger that can result in greater erosion of the river’s banks and bed”. Which is another brazen Satanic Inversion. Rivers with high amounts of particulate matter in them eat away at river banks more assiduously than those with less. It’s like removing the abrasive from a polish.
Can you see how “experts” is general?
The propagandist at VOA News has put forward this ridiculous plausible-deniability excuse because they know that many or most readers will grasp virtually any straw to remain off the hook of personal responsibility.
The author continues: “The experts and people living along the river blame a large hydroelectric dam upstream in Laos that began operating in October for contributing to both problems, though rainfall has also been sparse.”
When, in fact, from 2019 to 2020, Thailand’s rainfall increased by 13% to the second-highest total in history, second only to 1961.
I have exposed the duplicity of VOA News by using what was known in the old days as “fact checking”.
For those unaware, anytime an author is uncredited, it is proof that said author is an Intelligence operative.
VOA News’ use of the brazen falsehood “though rainfall has also been sparse” is an example of the propaganda technique known as the “Big Lie”, so favored by Hitler, Goebbels and small-town Mayors the world over.
Can you see how “a large hydroelectric dam” is general? What role did the dam play? What sudden change took place in the dam’s operation that caused the water to suddenly become clear, and turn a brilliant blue?
Blue is the color of orgone energy.
I learned that from Don Croft, and if I recall correctly he was citing Wilhelm Reich.
Ah, here we go “In 1939 Reich was performing one of his "bion experiments” — he believed that bacteria and amoeba-like organisms arose spontaneously in sterile dirt and coal, if soaked in water for sufficient time — and one of his assistants accidentally prepared a sample with sterilized ocean sand instead of using sterilized dirt.[2] Under the microscope, this sample seemed to show an “intense blue glimmer”, and soon Reich started noticing all sorts of effects in the room where the experiment was taking place that could be described as “blue” or as “glowing”. When he gave this sample to a radium physicist to test, the physicist reported that he could detect “no radiation” being given off by the sample, so Reich concluded that he was seeing an entirely new, previously undiscovered form of radiation which he called "orgone radiation”.[3]” (per rationalwiki).
In 2019, Chicago, Illinois’ new snowfall record for October 31 was 3.4 inches.
In 2019, Springfield Illinois set a new daily snowfall record for January 12 of 8.4 inches.
In 2019, Baltimore, Maryland had a total of 38.1 inches of precipitation.
In 2019, the mean maximum temperature in the twin cities of Minneapolis and St. Paul in Minnesota was 53.5 degrees.
In 2019, 703 structures were destroyed by brush fires in California.
In 2019, there were 7,148 brush fires in California.
In 2019, there were 1,975,086 acres burned by brush fires in California.
In 2019, the average number of acres burned per brush fire in California was 276.3.
In 2019, Ottowa, Canada set a new monthly snowfall record for January of 97 centimeters, which was 4% greater than the previous record of 93 centimeters set in 1999.
In 2019, Queensland, Australia set a new monthly rainfall record for January of 833 millimeters, which was 7.6% greater than the previous record of 774.2 millimeters set in 2010.
In 2019, the Tri-Cities area of Tennessee and Virginia set a new daily rainfall record of 1.75 inches, which was 19% greater than the previous record of X inches set in Y (verify).
In 2019, Springfield, Illinois set a new daily snowfall record for January 12 of 8.4 inches, which was 27% greater, or almost one third greater than the previous record of 6.6 inches set on January 12, 1964.
In May 2020, the Pennsylvania state record flathead catfish weighed 56.3 pounds, and was 29% larger, or almost one third larger than the previous 43-pound, 9-ounce record holder from 1985.
In May 2020, the 29% increase in size of the Pennsylvania state record flathead catfish and the 27% increase in the Springfield, Illinois daily snowfall record for July 12 in 2019 were statistically very similar.
In 2019, Caribou, Maine set a new record for January snowfall of 59.8 inches, which was 34% greater, or inches greater than the previous record of 44.5 inches set in January 1991.
In 1991, it was claimed that 1991 was the second hottest year on record. In 2019, it was claimed that 2019 was the second-hottest year on record.
Essay: Explain the role of record temperature in record snowfall events.
From 2019 to 2020, precipitation in Baltimore, Maryland increased by 50.6%, or by half, or by 19.3 inches, from 38.1 inches to 57.4 inches.
In 2019, winter rainfall in Los Angeles was 55% above average (verify).
In February 2019, Squaw Valley (now Palisades Tahoe) had the snowiest February in history, at 315 inches, which was 60.7% greater, or nearly two thirds greater, or 119 inches greater than the previous record of 196 inches set in February 2017.
On January 29, 2019, Toronto, Canada’s new snowfall record for the date of 10.4 inches was 97% greater, or basically two times greater, or 5.1 inches greater than the previous record of 5.3 inches from January 29, 2009.
From 2019 to 2020, the 117.9% increase in acres burned by brush fires in California was 461.4% greater, or more than five and a half times greater than the 21% increase in brushfires there during the same time period.
This documents the criminal activity of generational Satanist Freemason firefighters in California.
From 2019 to 2020, the 50.6% increase in precipitation in Baltimore, Maryland was 655.2% greater, or more than seven and a half times greater than its 6.7% average annual increase from 2012 to 2020.
The great positive change is increasing hyper-exponentially, going forward in times, because the health of the ether is inexorably improving, and precipitation varies directly with the health of the ether.
From 2019 to 2020, the 50.6% increase in precipitation in Baltimore, Maryland was 41,375.4% greater, or more than four hundred times greater than its .122% average annual increase from 1870 to 2020.
The great positive change is increasing hyper-exponentially, going forward in times, because the health of the ether is inexorably improving, and precipitation varies directly with the health of the ether.
In January 2020, the New York times said “2019 Was Second-Hottest Year On Record”.
When, in fact, in 2019, Caribou, Maine set a new record for January snowfall of 59.8 inches, which was 34% greater, or inches greater than the previous record of 44.5 inches set in January 1991.
Further, from 1991, which at the time was purported to be the second-hottest year on record, to 2019, which at the time was purported to be the second-hottest year on record, the mean maximum temperature in the twin cities of Minneapolis and St. Paul in Minnesota decreased by 2.7%, or by 1.5 degrees, from 55 degrees to 53.5 degrees.
I have exposed the duplicity of the New York Times and NOAA by using what was known in the old days as “fact checking”.
In 2020, Baltimore, Maryland had a total of 57.4 inches of precipitation.
In 2020, the 1.3 average number of structures destroyed per brush fire in California was 1,200% greater, or thirteen times greater than the .1 average number of structures destroyed in 2019.
This documents the criminality of generational Satanist Freemason arsonists and firefighters in California.
On February 10, 2021, bkktribune.com said (in block capitals) “MEKONG TURNS BLUE, AGAIN”.
Where the uncredited author put the headline in block capitals to create unease, where “Mekong River” was walked back to “Mekong” under the false guise of familiarity, and where “becomes clear” is walked back to “turns blue”, to distract the reader from the fact that the Mekong River had once again suddenly become clear.
For those unaware, anytime an author is uncredited, it is proof that said author is an Intelligence Operative.
Here’s the picture that accompanies the article.

(The Mekong River in Thailand suddenly turns blue again, February 2021)
The subhead goes on to say “Thailand’s space development agency has released the satellite photographs showing the water color of the Mekong River has turned to blue-green, while the river has been experiencing unusually dry again since early this year”.
Where the hilarious and spectacularly ignorant “has been experiencing unusual dry again” is Mil-speak for “the authorities in Thailand once again artificially dropped the level of the river.”
We previously reviewed news accounts documenting record rainfall and flooding across Thailand in August 2020, and again in December 2020.
I have exposed the duplicity of the Bangkok Tribune by using what was known in the old days as “fact checking”.
The article goes on to say “The agency noted that the aquamarine hue of the river has reflected how low the water levels in the river have dropped over the past month”.
The Mekong River dropped in February 2021 because the folks running the dams drained the river, to provide a lame-ass cover story, just as they’d done the last time the river suddenly became clear, in December 2019.
For those in the Punch and Judy tent, lowering the water level would decrease clarity, not increase it.
In 2022, the average temperature in the Twin Cities area of Minnesota was 46 degrees.
In 2024, the mean maximum temperature in the Twin Cities of Minneapolis and St. Paul in Minnesota was 59.4 degrees.
Jeff Miller, Pittsburgh, PA, August 7, 2021, revised June 27, 2025
If you’d like to be added to this free mailing list, or know someone who would be, please send me a note at [email protected]