“There are a thousand hacking at the branches of evil to one who is striking at the root.”
Henry David Thoreau
In 1856, Physicist John Tyndall fabricated the theory of “the greenhouse effect” to obscure the fact that air temperature and precipitation both vary directly with the health of the ether.
“The discovery of the greenhouse effect is attributed to several scientists over time. Joseph Fourier first proposed the concept in the 1820s, suggesting that the Earth’s atmosphere traps heat. Eunice Foote later demonstrated the effect of carbon dioxide in trapping heat in 1856. Finally, John Tyndall provided experimental evidence in 1859, identifying specific gases like carbon dioxide and water vapor as key absorbers of infrared radiation”.
AI Overview
fabricated - verb - past tense: invent or concoct (something), typically with deceitful intent.
It is Physicist John Tyndall’s fabricated theory of “the greenhouse effect” which sits at the base of the theory of “global warming”, or increasing air temperatures and precipitation driven by increasing levels of Carbon Dioxide in the atmosphere.
In the data below, I have presented 101 statistics which prove that John Tyndall’s theory of a Carbon Dioxide-driven “greenhouse effect” is false.
Here’s a portrait of Physicist John Tyndall, the Patron Saint of the “greenhouse effect”, where he has his hand against his face in a purportedly-secret Masonic “gesture of recognition”.
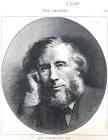
(Physicist John Tyndall)
Now, here are a variety of 19th Century depictions of Masonic “gestures of recognition”, including the hand-to-face gesture used by John Tyndall in the portrait immediately above.
(19th Century depictions of Masonic “gestures of recognition”.)
Now, here’s the Linkedin profile picture Software Engineer, in a Satanic Purple jacket, with a Satanic green background, using her left hand to make a purportedly-secret Masonic “gesture of recognition.”

(Software Engineer, in a Satanic Purple jacket, with a Satanic green background, using her left hand to make a purportedly-secret Masonic “gesture of recognition”.)
And don’t forget Walt Disney, shown here using his left hand to make the same purportedly-secret Masonic “gesture of recognition” that generational Satanist Freemasons John Tyndall and the anonymous software engineer are in the photos immediately above.
(Walt Disney)
I have included these photos so that you could get a better idea of what generational Satanist Freemasons of varying influence look like.
They are all related to one another through the maternal bloodline. Generational Satanists comprise between twenty and thirty percent of the populace, and are hiding in plain sight in every city, town and village on Earth.
It’s how the few have controlled the many all the way back to Babylon, and before.
But they say that the hardest part of solving a problem is recognizing that you have one.
Don Croft used to say “Parasites fear exposure above all else”.
THE DATA
From 1880 to 1890, Baltimore, Maryland’s average annual precipitation of 47.2 inches was 3.3% above the long-term annual average of 45.6 inches from 1871 to 2020.
Since this statistic is so early in the “industrial era”, it proves that Physicist John Tyndall’s 1856 theory that a Carbon Dioxide-driven “greenhouse effect” increases air temperature and precipitation is false. (1)
The truth is that air temperature and precipitation both vary directly with the health of the ether.
From 1880 to 1890, Baltimore, Maryland’s average annual precipitation of 47.2 inches was 14.3% greater than its average of 41.3 inches from 1871 to 1880.
Since this statistic is so early in the “industrial era”, it proves that Physicist John Tyndall’s 1856 theory a Carbon Dioxide-driven “greenhouse effect” increases air temperature and precipitation is false. (2)
The truth is that air temperature and precipitation both vary directly with the health of the ether.
Here, from 1880 to 1990, prior to radio really getting underway in earnest, the health of the ether was improving significantly, going forward in time.
From 1881 to 2016, the average temperature in Minnesota’s Twin Cities area increased by an annual average of .019%.
From 1881 to 2016, the average temperature in Minnesota’s Twin Cities area increased by .65%, or by .3 degrees, from 46.1 degrees to 46.4 degrees.
If Carbon Dioxide-driven increases in temperature are factual, then how could the temperature in Minnesota’s Twin Cities increase by just one third of one degree from 1881 to 2016?
This statistic proves that Physicist John Tyndall’s 1856 theory that a Carbon Dioxide-driven “greenhouse effect” increases air temperature and precipitation is false. (3)
The truth is that air temperature and precipitation both vary directly with the health of the ether.
From 1881 to 2016, the average temperature in Minnesota’s Twin Cities area increased by .65%, or by .3 degrees, from 46.1 degrees to 46.4 degrees.
If Carbon Dioxide-driven increases in temperature are factual, then the miniscule .3-degree increase in temperature in Minnesota’s Twin Cities area from 1881 to 2016 would not be possible.
This statistic proves that Physicist John Tyndall’s 1856 theory that a Carbon Dioxide-driven “greenhouse effect” increases air temperature and precipitation is a ruse. (4)
ruse - noun - an action intended to deceive someone; a trick.
The truth is that air temperature and precipitation both vary directly with the health of the ether.
From 1881 to 1911, the average temperature in Minnesota’s Twin Cities area decreased by an annual average of .07%.
From 1881 to 1911, the average temperature in Minnesota’s Twin Cities area decreased by 2.2%, from 46.1 degrees to 45.1 degrees.
If Carbon Dioxide-driven increases in temperature are factual, then the 2.2% decrease in temperature in Minnesota’s Twin Cities area from 1881 to 1911 would not be possible.
This statistic proves that Physicist John Tyndall’s 1856 theory that a Carbon Dioxide-driven “greenhouse effect” increases air temperature and precipitation is false. (5)
false - adjective - 1. not according with truth or fact; incorrect.
- appearing to be the thing denoted; deliberately made or meant to deceive.
The truth is that air temperature and precipitation both vary directly with the health of the ether.
From February 1885 to December 2004, the snowfall record in Corpus Christi, Texas increased by an annual average of .02%.
From February 1885 to December 2004, the snowfall record in Corpus Christi, Texas increased by 2.3%, from 4.3 inches to 4.4 inches.
From 1899 to 2022, Denver, Colorado’s all-time low temperature record for February 23 decreased by an annual average of .4%.
From 1899 to 2022, Denver, Colorado’s all-time low temperature record for February 23 decreased by 42.8%, from -4 degrees Fahrenheit to -7 degrees Fahrenheit.
On February 23, 1899, Denver Colorado set a new all-time low temperature record for the date, at -4 degrees Fahrenheit.
From 1905 to 1930, the Oklahoma all-time state cold temperature record remained unchanged, at -27 degrees.
This statistic proves that Physicist John Tyndall’s 1856 theory that a Carbon Dioxide-driven “greenhouse effect” increases air temperature and precipitation is false. (6)
The truth is that air temperature and precipitation both vary directly with the health of the ether.
From 1911 to 2016, the average temperature in Minnesota’s Twin Cities area increased by 10.2%, and then decreased by 6.6% from 2016 to 2018, or by 4.6 degrees, from 45.1 degrees to 49.7 degrees.
If a carbon-driven “greenhouse effect” existed, the hyper-exponential 6.6% decrease of 4.6 degrees from 2016 to 2018 would not be possible.
This latter statistic proves that Physicist John Tyndall’s 1856 theory that a Carbon Dioxide-driven “greenhouse effect” increases air temperature and precipitation is false. (7)
Temperatures in Minnesota’s Twin Cities area increased by 10.2% from 1911 to 2016 not because of “carbon driven global warming”, but rather because of the technology-driven decrease in health of the ether over that time period. Then they then decreased by 6.6% in just two years from 2016 to 2018 because the health of the ether was inexorably improving, coming out of the end of the Mayan “long count” in 2012.
The truth is that air temperature and precipitation both vary directly with the health of the ether.
From 1914 to 2017, the October Monthly record for snowfall in Havre, Montana increased by an annual average of .7%.
From 1914 to 2017, that latter which is currently claimed to be the hottest year in history, the October monthly record for snowfall in Havre, Montana increased by 72%, or by almost three fourths, or by 6.2 inches, from 8.6 inches to 14.8 inches.
The National Weather Service in Great Falls, Montana said “However, with the power out, we’ll need some time to verify the record.”
They’re using a propaganda technique known as “stonewalling” or “slow-playing”.
This statistic suggests that the claim that 2017 was the hottest year in history is false. (8)
From 1915 to 2017, the latter which is at this writing purported to be the hottest in history, the daily snowfall record for May 18 in Cheyenne, Wyoming increased by an annual average of 1.2%.
From 1915 to 2017, the latter which is at this writing purported to be the second-hottest year in history, the snowfall record for May 19 in Cheyenne, Wyoming increased by 16.6%, or by almost one fifth, from 3 inches to 3.5 inches.
This statistic proves that Physicist John Tyndall’s 1856 theory that a Carbon Dioxide-driven “greenhouse effect” increases air temperature and precipitation is false. (9)
The truth is that air temperature and precipitation both vary directly with the health of the ether.
Given that precipitation and air temperature both vary directly with the health of the ether, this statistic documents that the health of the ether in Cheyenne, Wyoming was at its highest level in history in 2017.
National Weather Service meteorologist Tim Trudel said the new record “just beat” the old.
Tim’s description of a near-20% increase as “just beat” is a false.
just - adverb - only, just
beat - verb, transitive - II.17 .a. To do better than (an existing benchmark or achievement); to surpass (a record, score, time, etc.).
false - adjective - 1. not according with truth or fact; incorrect.
- appearing to be the thing denoted; deliberately made or meant to deceive.
I have exposed the duplicity of Meteoroligist Tim Trudel and the National Weather Service by using what was known in the old days as “fact checking”.
Here’s a picture of Tim Trudel, against a Satanic-green Kabbalist “Tree of Life” background.

(National Weather Service Meteorologist Tim Trudel)
I have included his picture so that you could get a better idea of what a generational Satanist Freemason of marginal influence looks like.
They are all related to one another through the maternal bloodline. Generational Satanists comprise between twenty and thirty percent of the populace, and are hiding in plain sight in every city, town and village on Earth. It’s how the few have controlled the many all the way back to Babylon, and before.
But they say that the hardest part of solving a problem is recognizing that you have one.
Don Croft used to say “Parasites fear exposure above all else”.
How long do you think that these people have left in power, now?
Please consider doing what you can to help speed the transition.
From 1915 to 2017, the daily snowfall record for May 18 in Cheyenne, Wyoming increased by 120%, or by more than two times, from 5 inches to 11 inches.
This statistic proves that Physicist John Tyndall’s 1856 theory that a Carbon Dioxide-driven “greenhouse effect” increases air temperature is false. (10)
The truth is that both air temperature and precipitation vary directly with the health of the ether.
On May 18, 1915, 5 inches of snow fell in Cheyenne, Wyoming, the all-time record for the date.
From 1920 to 1930, Baltimore, Maryland’s average annual precipitation of 42.3 inches was 17.8% below the long-term average of 45.6 inches from 1871 to 2020.
If increased levels of Carbon Dioxide in the atmosphere drive increases in precipitation, then the preciptation in Baltimore, Maryland from the heavily industrial decade from 1920 to 1930 could not be almost one fifth below the long-term average precipitation there from 1881 to 1920.
This statistic proves that Physicist John Tyndall’s 1856 theory that a Carbon Dioxide-driven “greenhouse effect” increases air temperature and precipitation is false. (11)
The truth is that air temperature and precipitation both vary directly with the health of the ether, and, from 1920 to 1930, the health of the ether was being degraded exponentially by the collective negative influence of electrical grids, the telephone, telegraph, radio, radar, et al.
From 1924 to 2013, the low temperature in Santiago, Chile increased by an annual average of .4%.
From 1924 to 2013, the low temperature in Santiago, Chile increased by 34.8%, or by more than one third, from 4.6 degrees below zero, Celsius, or 23.7 degrees Fahrenheit, to 3 degrees below zero, Celisus, or 26.6 degrees Fahrenheit.
Given that air temperature varies directly with the health of the ether, this statistic documents that the health of the ether in Santiago, Chile decreased exponentially from 1924 to 2013.
In 1924, the low temperature in Santiago, Chile was 4.6 degrees below zero, Celsius, or 23.7 degrees Fahrenheit, the lowest in history.
From 1925 to 2009, the Maine all-time cold temperature record decreased by an annual average of .02%.
From 1925 to January 16, 2009, the Maine all-time cold temperature state record decreased by 2%, from -48 degrees Fahrenheit to -50 degrees.
This statistic proves that Physicist John Tyndall’s 1856 theory that a Carbon Dioxide-driven “greenhouse effect” increases air temperature and precipitation is false. (12)
The truth is that air temperature and precipitation both vary directly with the health of the ether.
From 1930 to 2014, the linear trend of the data show the warming rate in the Gulf of Maine was basically flat, at only 0.004 deg C/decade.
This statistic proves that Physicist John Tyndall’s 1856 theory that a Carbon Dioxide-driven “greenhouse effect” increases air temperature and precipitation is false. (13)
The truth is that both air temperature and precipitation vary directly with the health of the ether.
From 1930 to February 10, 2011, the Oklahoma all-time state cold record decreased by 15%, from -27 in 1905 and 1930 to -31 degrees.
This statistic proves that Physicist John Tyndall’s 1856 theory that a Carbon Dioxide-driven “greenhouse effect” increases air temperature and precipitation is false. (14)
The truth is that air temperature and precipitation both vary directly with the health of the ether.
From 1930 to 2011, the Oklahoma all-time cold temperature state record decreased by an annual average of .19%.
From 1930 to February 10, 2011, the 15% decrease in the Oklahoma all-time state cold temperature record was infinitely greater than its 0% increase from 1905 to 1930.
This statistic proves that Physicist John Tyndall’s 1856 theory that a Carbon Dioxide-driven “greenhouse effect” increases air temperature and precipitation is false. (15)
The truth is that air temperature and precipitation both vary directly with the health of the ether.
From 1930 to 1940, Baltimore, Maryland’s average annual precipitation of 46.9 inches was 2.8% above the long-term average of 45.6 inches from 1871 to 2020.
This statistic proves that Physicist John Tyndall’s 1856 theory that a Carbon Dioxide-driven “greenhouse effect” increases air temperature and precipitation is false, and documents the poisoning of the ether by radio, radar, television and wireless phone and computer technology. (16)
The truth is that air temperature and precipitation vary directly with the health of the ether.
In 1938-1939, Caribou, Maine had no snow, the least in history.
Given that both precipitation and air temperature vary directly with the health of the ether, this statistic demonstrates that the health of the ether in Maine decreased exponentially from 1937 to 1938, thanks to the Dead Orgone Radiation, or death energy generated by World War II.
From 1939-1940 to 1940-1941, annual snowfall in Caribou, Maine increased by 66%, or by two thirds, or by 44.2 inches, from an all-time high 66.9 inches to an all-time-high 111.1 inches.
In 1939-1949, Caribou, Maine had a total of 66.9 inches of snow.
From 1940-1941 to 1954-1955, Caribou, Maine’s greatest-ever annual snowfall total increased by an annual average of 4.5%.
From 1940-41 to 1954-1955, Caribou, Maine’s annual snow total increased by 63%, or by almost two thirds, or by 70 inches, from 111.1 inches to 181.1 inches.
From 1940 to 1950, Baltimore, Maryland’s average annual precipitation of 42.3 inches was 7.8% below the long-term average of 45.6 inches from 1871 to 2020.
This statistic proves that Physicist John Tyndall’s 1856 theory that a Carbon Dioxide-driven “greenhouse effect” increases air temperature and precipitation is false, and documents the poisoning of the ether by radio, radar, television and wireless phone and computer technology. (17)
The truth is that air temperature and precipitation vary directly with the health of the ether.
From 1940 to 1950 versus 1930 to 1940, the 178.5% positive variance in the decrease below the mean in precipitation in Baltimore, Maryland from 1871 to 2020 was 67% greater, or two thirds greater than its 106.9% positive variance from 1920 to 1930 versus 1910 to 1920.
I’m guessing that this decrease in precipitation was driven not only by the ongoing, cumulative impact of wireless telegraph, ever-expanding electrical grids, radio, radar, television, et al, but also by the Death energy from World War II.
This statistic proves that Physicist John Tyndall’s 1856 theory that a Carbon Dioxide-driven “greenhouse effect” increases air temperature and precipitation is false, and documents the poisoning of the ether by radio, radar, television and wireless phone and computer technology.
The truth is that air temperature and precipitation vary directly with the health of the ether.
From 1940 to 1950, the 7.8% decrease below the mean in precipitation in Baltimore, Maryland from 1871 to 2020 was 178.5% greater, or almost three times greater than its 2.8% decrease below the mean from 1930 to 1940.
This statistic proves that Physicist John Tyndall’s 1856 theory that a Carbon Dioxide-driven “greenhouse effect” increases air temperature and precipitation is false, and documents the poisoning of the ether by the Death energy generated in World War II, along with radio, radar, television and wireless phone and computer technology, et al. (18)
The truth is that precipitation and air temperature both vary directly with the health of the ether.
From 1940-1941 to 1943-1944, annual snowfall in Caribou, Maine decreased by an annual average of 19.9%
From 1940-1941 to 1943-1944, annual snowfall in Caribou, Maine decreased by 59.8%, or by 66.5 inches, from 111.1 inches, the most in history, to 44.6 inches.
From 1940-1941 to 1941-1942, annual snowfall in Caribou, Maine decreased by 17.2%, from an all-time high 111.1 inches to 92 inches.
From 1940-1941 to 1941-1942, annual snowfall in Caribou, Maine decreased by 17.2%, or by 19.1 inches, from 111.1 inches, the most in history, to 92 inches.
From 1940-1941 to 1941-1942, the 17.2% decrease in annual snowfall in Caribou, Maine was 126% less, or over two times less than its 66% increase from 1939-1940 to 1940-1941.
Given that both precipitation and air temperature vary directly with the health of the ether, this statistic demonstrates that the health of the ether in Maine decreased exponentially from 1941 to 1942, thanks to the death energy generated by World War II.
In 1940-1941, Caribou, Maine had a total of 111.1 inches, the most in history.
From 1941-1942 to 1942-1943, annual snowfall in Caribou, Maine decreased by 31.3%, or by almost one third, or by 28.8 inches, from 92 inches to 63.2 inches.
From 1941-1942 to 1942-1943, the 31.3% decrease in annual snowfall in Caribou, Maine was 81.9% greater, or almost two times greater than its 17.2% decrease from 1940-1941 to 1941-1942.
Given that both precipitation and air temperature vary directly with the health of the ether, this statistic demonstrates that the health of the ether in Maine decreased exponentially from 1942 to 1943, thanks to the death energy generated by World War II.
In 1941-1942, Caribou, Maine had a total of 92 inches of snowfall.
From 1942-1943 to 1943-1944, annual snowfall in Caribou, Maine decreased by 18.6%, from 63.2 inches to 44.6 inches.
In 1942-1943, Caribou, Maine had a total of 63.2 inches of snowfall.
From 1943-1944 to 1944-1945, annual snowfall in Caribou, Maine increased by 91.3%, or by almost two times, or by 40.7 inches, from 44.6 inches to 85.3 inches.
From 1943-1944 to 1944-1945, the 91.3% increase in annual snowfall in Caribou, Maine was 590.9% greater, or almost six times greater than its 18.6% decrease from 1942-1943 to 1943-1944
Given that both precipitation and air temperature vary directly with the health of the ether, this statistic demonstrates that the health of the ether in Maine increased exponentially from 1944 to 1945, thanks to the end of World War II.
In 1943-1944, Caribou, Maine had a total of 44.6 inches of snowfall.
From 1944-1945 to 1945-1946, annual snowfall in Caribou, Maine increased by 15.3%, or by , or by 13.1 inches, from 85.3 inches to 98.4 inches.
In 1944-1945, Caribou, Maine had a total of 85.3 inches of snowfall
From 1945-1946 to 1946-1947, annual snowfall in Caribou, Maine increased by 10.6%, or by , or by 10.4 inches, from 98.4 inches to 108.8 inches.
From 1945-1946 to 1946-1947, the 10.6% increase in annual snowfall in Caribou, Maine was 30.7% less, or almost one third less than its 15.3% increase from 1944-1945 to 1945-1946.
Given that both precipitation and air temperature vary directly with the health of the ether, this statistic demonstrates that the health of the ether in Maine decreased from 1946 to 1947, thanks to the growing influence of what we collectively refer to as technology (radio, television, radar, high-tension power grids, et al).
In 1945-1946, Caribou, Maine had a total of 98.4 inches of snowfall.
In 1946-1947, Caribou, Maine had a total of 108.8 inches of snowfall.
From 1948 to 2017, Corpus Christi, Texas has had only eight days of snowfall on record.
From 1948 to 2017, 25%, or two of eight of Corpus Christi, Texas’ days of snowfall occurred from 2004 to 2017.
This statistic suggests that Physicist John Tyndall’s 1856 theory that a Carbon Dioxide-driven “greenhouse effect” increases air temperature and precipitation is false. (19)
The truth is that air temperature and precipitation both vary directly with the health of the ether. (18)
From 1949 to 1960, Caribou, Maine’s all-time record for consecutive days of measurable snowfall increased by 28.6%, from 7 days to 9 days.
From 1949 to 1956, consecutive days of measurable snowfall in Caribou, Maine decreased by 28.5%, or by almost one third, from 7 to 5.
Given that precipitation and air temperature vary directly with the health of the ether, this statistic documents the fact that the health of the ether in Caribou, Maine decreased exponentially from 1946 to 1956.
From 1949-1950 to 1954-1955, annual snowfall in Caribou, Maine increased by an annual average of 13.3%.
From 1949-1950 to 1954-1955, the 13.3% average annual increase in annual snowfall in Caribou, Maine was 25.5% greater, or one fourth greater than its 10.6% increase from 1945-1946 to 1946-1947.
Given that both precipitation and air temperature vary directly with the health of the ether, here we can see that the health of the ether in Maine was increasing exponentially from 1950 to 1955.
From 1949-1950 to 1954-1955, annual snowfall in Caribou, Maine increased by 66.4%, or by two thirds, or by 72.3 inches, from 108.8 inches to 181.1 inches, the greatest in history.
In 1949, Caribou, Maine set an all-time record for consecutive days of measurable snowfall of seven days.
From 1954 to 2012, South Carolina’s all-time high temperature record increased by an annual average of .03%.
From 1954-1955 to 2007-2008, Caribou, Maine’s annual snow total increased by an annual average of .2%.
From 1954-1955 to 2007-2008, Caribou, Maine’s annual snow total increased by 9.2%, from an all-time high 181.1 inches to the all-time high of 197.8 inches.
In 1954-1955, Caribou, Maine had a total of 181.1 inches of snow, the most in history.
From 1954-1955 to 2007-2008, Caribou, Maine’s annual snow total increased by an annual average of .2%.
In 1954, Baltimore, Maryland had an all-time low precipitation of 27.8 inches, which was 39% below the long-term average of 45.6 inches from 1871 to 2020.
If increased carbon dioxide in the atmosphere is driving increased air temperatures, which temperatures are in turn driving increased rainfall, as claimed, then how could the all time low rainfall number occur smack in the middle of the car boom of the 1950’s, versus in the decades preceding the invention of the automobile?
This statistic proves that Physicist John Tyndall’s 1856 theory that a Carbon Dioxide-driven “greenhouse effect” increases air temperature and precipitation is false, and documents the poisoning of the ether by radio, radar, television and wireless phone and computer technology. (19)
The truth is that air temperature and precipitation vary directly with the health of the ether.
In 1954-1955, Caribou, Maine’s greatest-ever annual snowfall total of 181.1 inches was 63% greater, or almost two thirds greater than the previous record of 111.1 inches from 1940-1941.
This statistic proves that Physicist John Tyndall’s 1856 theory that a Carbon Dioxide-driven “greenhouse effect” increases air temperature and precipitation is false, and documents the poisoning of the ether by radio, radar, television and wireless phone and computer technology. (20)
The truth is that air temperature and precipitation vary directly with the health of the ether.
Given that both precipitation and air temperature vary directly with the health of the ether, here we can see that the health of the ether in Maine was increasing exponentially from 1954 to 1955.
From 1956 to 1960, consecutive days of measurable snowfall in Caribou, Maine increased by 80%, or by more than three fourths, from 5 to 9.
This statistic proves that Physicist John Tyndall’s 1856 theory that a Carbon Dioxide-driven “greenhouse effect” increases air temperature and precipitation is false. (21)
The truth is that air temperature and precipitation both vary directly with the health of the ether.
Given that both precipitation and air temperature vary directly with the health of the ether, this statistic shows that the health of the ether in Maine was increasing hyper-exponentially from 1956 to 1960.
In February 1956, Caribou, Maine had 5 consecutive days of snowfall.
From 1960 to 1970, Baltimore, Maryland’s 372.5 inches of precipitation was 20.5% less, or one fifth less, or 96.3 inches less, or eight feet less than its 468.8 inches from 1930 to 1940.
This statistic proves that Physicist John Tyndall’s 1856 theory that a Carbon Dioxide-driven “greenhouse effect” increases air temperature and precipitation is false. (22)
The truth is that air temperature and precipitation both vary directly with the health of the ether.
Given the exponential increase in automobiles and industry from 1930 to 1940 versus 1960 to 1970, this decrease in precipitation from 1960 to 1970 versus 1930 to 1940 refutes the false claim that increasing levels of Carbon Dioxide in the atmosphere are driving a "greenhouse effect” which increases air temperature and rainfall.
Further, given that precipitation varies directly with the health of the ether, this huge decrease in precipitation from 1960 to 1970 documents the fact that the health of the ether has decreased by a huge margin from 1960 to 1970 versus 1930 to 1940, thanks to the cumulative increase in Death energy in the ether from wireless transmissions of radio, radar and television signals, high tension wires, ad infinitum.
Wilhelm Reich referred to this Death energy as “Dead Orgone Radiation”.
From 1960 to 1970, Baltimore, Maryland’s average rainfall of 37.3 inches was 22% below the long-term average of 45.6 inches from 1871 to 2020.
This statistic proves that Physicist John Tyndall’s 1856 theory that a Carbon Dioxide-driven “greenhouse effect” increases air temperature and precipitation is false, and documents the poisoning of the ether by radio, radar, television and wireless phone and computer technology. (23)
The truth is that air temperature and precipitation vary directly with the health of the ether.
From 1960 to 1991, Caribou, Maine’s record for the most consecutive days of snowfall remained unchanged, at 5 days.
From February 2, 1963 to February 2, 2023, Mount Washington’s record-low temperature for the date decreased by an annual average of .5%.
From February 2, 1963 to February 2, 2023, Mount Washington’s record-low temperature for the date decreased by 29%, or by thirteen degrees, from -32 degrees to -45 degrees.
From 1963 to 2012, the .48% average annual decrease in Mount Washington’s record-low temperature for February 2 was 1,450% greater, or more than fifteen times greater than the .03% average annual increase in South Carolina’s all-time high state temperature record.
This statistic proves that Physicist John Tyndall’s 1856 theory that a Carbon Dioxide-driven “greenhouse effect” increases air temperature and precipitation is false.
The truth is that air temperature and precipitation both vary directly with the health of the ether. (24)
From 1968-69 to 2016-17, the amount of days that Caribou, Maine had a foot or more of snow on the ground increased by an annual average of .2%
From 1968-69 to 2016-17, the amount of days that Caribou, Maine had a foot or more of snow on the ground increased by 10%, from an all-time high 120 days to an all-time high 132 days.
This statistic proves that Physicist John Tyndall’s 1856 theory that a Carbon Dioxide-driven “greenhouse effect” increases air temperature and precipitation is false.
The truth is that air temperature and precipitation both vary directly with the health of the ether. (25)
In 1968-69, Caribou, Maine had a foot or more of snow on the ground for 120 days, an all-time record.
This statistic proves that Physicist John Tyndall’s 1856 theory that a Carbon Dioxide-driven “greenhouse effect” increases air temperature and precipitation is false.
The truth is that air temperature and precipitation both vary directly with the health of the ether. (25)
From 1970 to 2020, the .122% average annual increase in annual precipitation in Baltimore, Maryland was 84.5% less, or almost two times less than its .79% average annual increase from 1870 to 1980.
This statistic proves that Physicist John Tyndall’s 1856 theory that a Carbon Dioxide-driven “greenhouse effect” increases air temperature and precipitation is false, and documents the poisoning of the ether by microwave radiation generated by radio, radar, television and wireless phone and computer technology, et al.
The truth is that air temperature and precipitation vary directly with the health of the ether. (26)
From 1979 to 2019, the Hawaii all-time cold state temperature record decreased by an annual average of .83%.
From 1979 to 2019, the Hawaii all-time state cold record decreased by 33.3%, or by one third, from 12 degrees to 8 degrees.
This statistic proves that Physicist John Tyndall’s 1856 theory that a Carbon Dioxide-driven “greenhouse effect” increases air temperature and precipitation is false.
The truth is that air temperature and precipitation both vary directly with the health of the ether. (27)
From 1980 to 1990, Baltimore, Maryland’s average annual precipitation of 39.3 inches was 16.3% below the long-term annual average of 45.6 inches from 1871 to 2020.
Given the increase in automobiles and industry from 1980 to 1990 versus 1970 to 1980, this very large decrease in precipitation proves that Physicist John Tyndall’s 1856 theory that a Carbon Dioxide-driven “greenhouse effect” increases air temperature and precipitation is false. (28)
The truth is that air temperature and precipitation both vary directly with the health of the ether.
From 1980 to 1990, Baltimore, Maryland’s 392.2 inches of precipitation was 13.8% less, or 63.8 inches less, or more than five feet less than its 456 inches from 1970 to 1980.
Given the increase in automobiles and industry from 1980 to 1990 versus 1970 to 1980, this very large decrease in precipitation proves that Physicist John Tyndall’s 1856 theory that a Carbon Dioxide-driven “greenhouse effect” increases air temperature and precipitation is false. (29)
The truth is that air temperature and precipitation both vary directly with the health of the ether.
From 1981 to 2010, annual snowfall in Caribou, Maine averaged 108.7 inches.
In 1982-83, the 88.5 inches of precipitation in the Northern California water year was the greatest in history.
From 1991 to 2019, the mean maximum temperature in the twin cities of Minneapolis and St. Paul in Minnesota decreased by an annual average of .1%.
From 1991, which was purported at that time to be the second-hottest year in history, to 2019, which at this writing in 2025 is purported to be the second-hottest year in history, the mean maximum temperature in the twin cities of Minneapolis and St. Paul in Minnesota decreased by 2.7%, or by 1.5 degrees, from 55 degrees to 53.5 degrees.
This proves that Physicist John Tyndall’s 1856 theory a Carbon Dioxide-driven “greenhouse effect” increases air temperature and precipitation is false. (33)
The truth is that air temperature and precipitation both vary directly with the health of the ether.
From 1991 to 2013, Caribou, Maine’s all-time record for consecutive days of measurable snowfall increased by an annual average of .5%.
From 1991 to 2013, Caribou, Maine’s all-time record for consecutive days of measurable snowfall increased by 11.1%, from 9 days to 10 days.
This statistic proves that Physicist John Tyndall’s 1856 theory that a Carbon Dioxide-driven “greenhouse effect” increases air temperature and precipitation is false.
The truth is that air temperature and precipitation both vary directly with the health of the ether. (34)
From 1991-1992 to 2007-2008 Caribou, Maine’s annual snowfall increased by an annual average of 6.9%.
From 1991-1992 to 2007-2008, annual snowfall at Caribou, Maine increased by 110.4%, or by more than two times, or by 103.8 inches, from 94 inches to 197.8 inches, the most in history.
This statistic proves that Physicist John Tyndall’s 1856 theory that a Carbon Dioxide-driven “greenhouse effect” increases air temperature and precipitation is false. (35)
The truth is that air temperature and precipitation both vary directly with the health of the ether.
From 1991-1992 to 2007-2008, the 6.9% average annual increase in Caribou, Maine’s annual snowfall total was 3,350% greater, or more than thirty four times greater than its .2% average annual increase from 1954-55 to 1991-1992.
This statistic proves that Physicist John Tyndall’s 1856 theory that a Carbon Dioxide-driven “greenhouse effect” increases air temperature and precipitation is false. (36)
The truth is that air temperature and precipitation both vary directly with the health of the ether.
Given that both precipitation and air temperature vary directly with the health of the ether, here we can see that the health of the ether in Maine was increasing exponentially from 1991 to 2008.
In 1991-1992, Caribou, Maine had a total of 94 inches of snow.
In January 1991, Caribou, Maine tied its all-time record for consecutive days of measurable snowfall at nine days. The previous record was set in February 1960.
On September 29, 1991, Caribou, Maine had it’s earliest snowfall in history, of 2.1 inches.
This statistic proves that Physicist John Tyndall’s 1856 theory that a Carbon Dioxide-driven “greenhouse effect” increases air temperature and precipitation is false. (37)
The truth is that air temperature and precipitation both vary directly with the health of the ether.
In January 1992, the Washington Post said “1991 is called ‘2nd Warmest’ Year On Record”.
When, in fact, on September 29, 1991, Caribou, Maine had it’s earliest snowfall in history, 2.1 inches.
This statistic suggests that the claim that 1991 was the hottest year in history was false.
I have exposed the duplicity of the Washington Post by using what was known in the old days as “fact checking”.
From 1993 to 2019, the February snowfall record at Sugar Bowl ski resort increased by an annual average of .06%.
From 1993 to 2019, the February snowfall record at Sugar Bowl ski resort in California increased by 1.5%, from 263 inches to 267 inches.
This statistic proves that Physicist John Tyndall’s 1856 theory that a Carbon Dioxide-driven “greenhouse effect” increases air temperature and precipitation is false. (38)
The truth is that air temperature and precipitation both vary directly with the health of the ether.
Given that precipitation and temperature vary directly with the health of the ether, this statistic shows that the health of the ether in California was the greatest in history in 2019.
In 1993, Sugar Bowl ski resort in California set an all-time record for February snowfall of 263 inches.
This statistic proves that Physicist John Tyndall’s 1856 theory that a Carbon Dioxide-driven “greenhouse effect” increases air temperature and precipitation is false. (39)
The truth is that air temperature and precipitation both vary directly with the health of the ether.
In January 1993, United Press International said “Winter of 1992 warmest on record.”
From 1996 to 2016, the .6% average annual increase in New Jersey’s annual precipitation record was 3.2% less than its .62% average annual increase from 1996 to 2018.
This statistic proves that Physicist John Tyndall’s 1856 theory that a Carbon Dioxide-driven “greenhouse effect” increases air temperature and precipitation is false. (40)
The truth is that air temperature and precipitation both vary directly with the health of the ether.
From 1996-1997 to 2005-2006, annual snowfall in Caribou, Maine decreased by an annual average of 3%.
From 1996-1997 to 2005-2006, annual snowfall in Caribou, Maine decreased by 26.6%, or by more than one fourth, from 130.9 inches to 96 inches.
This statistic proves that Physicist John Tyndall’s 1856 theory that a Carbon Dioxide-driven “greenhouse effect” increases air temperature and precipitation is false. (41)
The truth is that air temperature and precipitation both vary directly with the health of the ether.
Snowfall in Caribou Maine was exponentially less in 2005-06 than it was in 1996-97 due to the deleterious influence of the low wavelength microwave radiation from what we collectively refer to as wireless technology on the health of the ether.
In 1996-1997, Caribou, Maine had a total of 130.9 inches of snow.
From 1999 to 2019, the Illinois all-time cold state record decreased by an annual average of .6%
From 1999 to 2019, .6% average annual decrease in the Illinois all-time cold state record was 1,900% greater, or more than twenty times greater than the .03% average annual increase in South Carolina’s all-time high temperature record from 1954 to 2012.
This statistic proves that Physicist John Tyndall’s 1856 theory that a Carbon Dioxide-driven “greenhouse effect” increases air temperature and precipitation is false. (42)
The truth is that air temperature and precipitation both vary directly with the health of the ether.
From 2000 to 2010, Baltimore, Maryland’s average annual precipitation of 45.4 inches was .4% below the long-term annual average of 45.6 inches from 1871 to 2020.
This proves that Physicist John Tyndall’s 1856 theory a Carbon Dioxide-driven “greenhouse effect” increases air temperature and precipitation is false. (43)
The truth is that air temperature and precipitation both vary directly with the health of the ether.
Baltimore, Maryland’s annual preciptation was less in 2005-06 than it was from 1871 to 2005 due to the deleterious influence of the low wavelength microwave radiation from what we collectively refer to as wireless technology on the health of the ether.
From 2000 to 2010, the .003% average annual increase in annual precipitation in Baltimore, Maryland was 96.3% less than its .082% average annual increase from 1870 to 2000.
This proves that Physicist John Tyndall’s 1856 theory that a Carbon Dioxide-driven “greenhouse effect” increases air temperature and precipitation is false. (44)
The truth is that air temperature and precipitation both vary directly with the health of the ether.
The increase in precipitation was hyper-exponentially less from 2000 to 2010 versus 1871 to 2000 due to the deleterious influence of the low wavelength microwave radiation from what we collectively refer to as wireless technology on the health of the ether.
From 2002-2003 to 2018-2019, the number of consecutive days that Caribou, Maine had at least one inch of snow on the ground increased by 5.2%, or by 8 days, from 155 days to 163 days.
Meteorologist Mal Walker omitted the percentage increase, and said, only-generally, that the new record “shattered the old record”.
Those are examples of the propaganda technique known as “stoneawalling”.
This statistic proves that Physicist John Tyndall’s 1856 theory that a Carbon Dioxide-driven “greenhouse effect” increases air temperature and precipitation is false. (45)
The truth is that air temperature and precipitation both vary directly with the health of the ether.
Snowfall in Maine increased from 2002 to 2019 because the health of the began to improve exponentially coincident with the end of the Mayan “long count” in 2012.
In 2002-2003, there was at least 1 inch of snow on the ground in Caribou, Maine for 155 days, the all-time record.
This statistic proves that Physicist John Tyndall’s 1856 theory that a Carbon Dioxide-driven “greenhouse effect” increases air temperature and precipitation is false. (46)
The truth is that air temperature and precipitation both vary directly with the health of the ether.
From 2004 to 2017, the snowfall record in Corpus Christi, Texas increased by an annual average of 4.8%.
From 2004 to 2017, the snowfall record in Corpus Christi, Texas increased by 62.7%, or by almost two thirds, from 4.4 inches to 7 inches.
From 2004 to 2017, the 4.8% average annual increase in the snowfall record in Corpus Christi, Texas was 23,900% greater, or more than 240 times greater than its .02% average annual increase from 1895 to 2004.
As that there was no sudden, hyper-exponential increase in Carbon Dioxide in 2004, or at any time previous to 2004, this statistic proves that Physicist John Tyndall’s 1856 theory that a Carbon Dioxide-driven “greenhouse effect” increases air temperature and precipitation is false. (47)
The truth is that air temperature and precipitation both vary directly with the health of the ether.
On December 24, 2004, 4.4 inches of snow fell in Corpus Christi, Texas, the all-time record.
From 2005-2006 to 2009-2010, annual snowfall in Caribou, Maine decreased by an annual average of 6.7%.
From 2005-2006 to 2009-2010, annual snowfall in Caribou, Maine decreased by 26.7%, or by more than one fourth, from 96 inches to 70.3 inches.
From 2005-2006 to 2009-2010, the 6.7% average annual decrease in snowfall in Caribou, Maine was 123.3% greater, or more than two times greater than its 3% average annual decrease from 1996-1997 to 2005-2006
Given that both precipitation and air temperature vary directly with the health of the ether, here we can see that the health of the ether in Maine was decreasing exponentially from 2005 to 2010, driven downward by the microwave radiation of what we collectively refer to as wireless technology.
In 2005-2006, Caribou, Maine had a total of 96 inches of snow.
On July 15, 2006, South Dakota’s all-time high temperature record remained unchanged, in a tie with Gann Valley on July 5, 1936.
This statistic proves that Physicist John Tyndall’s 1856 theory that a Carbon Dioxide-driven “greenhouse effect” increases air temperature and precipitation is false.
The truth is that air temperature and precipitation both vary directly with the health of the ether. (48)
In 2007-2008, Caribou, Maine had a total of 197.8 inches of snow, the most in history.
This statistic proves that Physicist John Tyndall’s 1856 theory that a Carbon Dioxide-driven “greenhouse effect” increases air temperature and precipitation is false.
The truth is that air temperature and precipitation both vary directly with the health of the ether. (48)
From 2009 to 2025, the 14-degree average decrease in the four all-time low state temperature records set in the United States was 1,455% greater, or more than fifteen times greater than the .9-degree average increase in its two all-time high state temperature records set from 2006 to 2025.
This statistic proves that Physicist John Tyndall’s 1856 theory that a Carbon Dioxide-driven “greenhouse effect” increases air temperature and precipitation is false. (49)
The truth is that air temperature and precipitation both vary directly with the health of the ether.
From 2009 to 2019, the average annual rate at which U.S. state cold records was broken was .5% .
From 2009 to 2019, .6% average annual increase in the Illinois all-time cold state record was 2,900% greater, or more than thirty times greater than the .02% average annual increase in the Maine all-time cold temperature record from 1925 to 2009.
This statistic proves that Physicist John Tyndall’s 1856 theory that a Carbon Dioxide-driven “greenhouse effect” increases air temperature and precipitation is false. (50)
The truth is that air temperature and precipitation both vary directly with the health of the ether.
In 2009-2010, Caribou, Maine had a total of 70.3 inches of snow.
From 2011 to 2017, snow cover in the lower 48 U.S. states on November 8 increased by an annual average of 4%.
From 2011 to 2017, the latter which is at this writing purported to be the hottest in history, snow cover in the lower 48 U.S. states on November 8 increased by 23.8%, or by almost one fourth, from 21% to 26%.
This statistic proves that Physicist John Tyndall’s 1856 theory that a Carbon Dioxide-driven “greenhouse effect” increases air temperature and precipitation is false. (51)
The truth is that air temperature and precipitation both vary directly with the health of the ether.
The statement that 2017 was the hottest year in history is false.
From 2012-13 to 2018-19, snowfall at the Squaw Valley ski area in California increased by an annual average of 7.9%.
From 2012-13 to 2018-19, snowfall at the Squaw Valley ski area in California i****ncreased by 47.6%, or by almost half, from 386 inches to 570 inches.
This statistic proves that Physicist John Tyndall’s 1856 theory that a Carbon Dioxide-driven “greenhouse effect” increases air temperature and precipitation is false. (52)
The truth is that air temperature and precipitation both vary directly with the health of the ether.
If both precipitation and air temperature vary directly with the health of the ether, then this statistic documents that the health of the ether in California was at its highest level in history in 2018-19.
From 2012 to 2017, snowfall in Seattle, Washington increased by an annual average of 3.8%.
From 2012 to 2017, the respective 3.8% and 4% average annual increases in snowfall in Seattle, Washington and snow cover in the lower 48 U.S. states on November 8 were statistically almost identical.
Snowfall is increasing exponentially at very similar rates regardless of geography because the health of the ether is inexorably improving, and both precipitation and air temperature vary directly with the health of the ether.
From 2012-13 to 2018-19, snowfall at the Squaw Valley ski area in California i****ncreased by 47.6%, or by almost half, from 386 inches to 570 inches.
This statistic proves that Physicist John Tyndall’s 1856 theory that a Carbon Dioxide-driven “greenhouse effect” increases air temperature and precipitation is false. (53)
This was coming off off 2012, which National Geographic referred to in 2013 as the hottest year in the history of the United States.
National Geographic’s claim that 2013 was the hottest year in the history of the United States is false.
In 2012, Seattle, Washington recorded 11.1 inches of snowfall.
In 2012-2013, an all-time high 386 inches of snow fell at the Squaw Valley ski resort in California.
This statistic proves that Physicist John Tyndall’s 1856 theory that a Carbon Dioxide-driven “greenhouse effect” increases air temperature and precipitation is false. (54)
The truth is that air temperature and precipitation both vary directly with the health of the ether.
On June 29, 2012, South Carolina’s all-time high temperature record increased by 1.8%, from 111 degrees in June 1954 to 113 degrees in 2012.
From 2013 to 2017, the low temperature in Santiago, Chile decreased by an annual average of 16.7%.
This statistic proves that Physicist John Tyndall’s 1856 theory that a Carbon Dioxide-driven “greenhouse effect” increases air temperature and precipitation is false. (55)
The truth is that air temperature and precipitation both vary directly with the health of the ether.
From 2013 to 2017, the latter which is at this writing purported to be the second-hottest in history, the low temperature in Santiago, Chile decreased by 66.6%, or by two thirds, from 3 degrees below zero, Celsius, or 26.6 degrees Fahrenheit to 5 degrees below zero, Celsius, or 25 degrees Fahrenheit, the lowest in history.
This statistic proves that Physicist John Tyndall’s 1856 theory that a Carbon Dioxide-driven “greenhouse effect” increases air temperature and precipitation is false. (56)
The truth is that air temperature and precipitation both vary directly with the health of the ether.
From 2013 to 2017, the latter which is at this writing purported to be the second-hottest in history, the 16.7% average annual decrease in the low temperature in Santiago, Chile was 517.5% greater, or more than six times greater than its .4% average annual increase from 1924 to 2013.
This statistic proves that Physicist John Tyndall’s 1856 theory that a Carbon Dioxide-driven “greenhouse effect” increases air temperature and precipitation is false. (57)
The truth is that air temperature and precipitation both vary directly with the health of the ether.
In 2013, the temperature in Santiago, Chile was 3 degrees below zero, Celsius, or 26.6 degrees Fahrenheit.
In January 2013, National Geographic said “2012 was the hottest year in U.S. And Yes - It’s Climate Change”.
When, in fact, from 2013 to 2017, the latter which is at this writing purported to be the second-hottest in history, the 16.7% average annual decrease in the low temperature in Santiago, Chile was 517.5% greater, or more than six times greater than its .4% average annual increase from 1924 to 2013.
National Geographic’s claim that 2012 was the hottest year in history is false.
I have exposed the duplicity of National Geographic by using what was known in the old days as “fact checking”.
In Febrauary 2013, 313 inches of snow fell at the Squaw Valley ski resort in California, setting the record for its snowiest February on record.
This statistic proves that Physicist John Tyndall’s 1856 theory that a Carbon Dioxide-driven “greenhouse effect” increases air temperature and precipitation is false. (58)
The truth is that air temperature and precipitation both vary directly with the health of the ether.
On December 24, 2013, Caribou, Maine set an all-time record for consecutive days of measurable snowfall of ten days.
This statistic proves that Physicist John Tyndall’s 1856 theory that a Carbon Dioxide-driven “greenhouse effect” increases air temperature and precipitation is false. (59)
The truth is that air temperature and precipitation both vary directly with the health of the ether.
In January 2015, NASA said “The year 2014 now ranks as the warmest on record since 1880”.
When, in fact, the temperature of the Gulf of Maine remained basically flat from 1930 to 2014.
NASA’s statement that 2014 was the hottest year in history is false.
I have exposed the duplicity of NASA by using what was known in the old days as “fact checking”.
From 2016 to 2018, the 3.3% average annual decrease in the average temperature in Minnesota’s Twin Cities area was 4,614.3% greater, or almost fifty times greater than its .07% average annual decrease from 1881 to 1911.
This statistic proves that Physicist John Tyndall’s 1856 theory that a Carbon Dioxide-driven “greenhouse effect” increases air temperature and precipitation is false. (60)
The truth is that the climate is cooling exponentially, versus warming, as fraudulently claimed, and that it is doing so because the health of the ether is inexorably improving, and air temperature and precipitation both vary directly with the health of the ether.
In 2016-17, the 89.7 inches of preciptiation in the Northern California water year was the greatest in history.
In 2016-17, 89.7 inches of precipitation in the Northern California water year, the all-time record, was 4% greater than the previous record of 88.5 inches set in 1982-83.
This statistic proves that Physicist John Tyndall’s 1856 theory that a Carbon Dioxide-driven “greenhouse effect” increases air temperature and precipitation is false. (59)
The truth is that air temperature and precipitation both vary directly with the health of the ether. (60)
Given that precipitation varies directly with the health of the ether, this statistic shows that the health of the ether in California was the greatest in history in 2016-17.
In October 2016, per Pew Research, almost seventy five percent of Americans did not trust that there was a large ‘scientific consensus’ amongst climate scientists on human behavior being the cause of climate change.
From November 30, 2016 to April 10, 2017, Caribou Maine had a foot or more of snow on the ground for 132 days, the all-time record.
This statistic proves that Physicist John Tyndall’s 1856 theory that a Carbon Dioxide-driven “greenhouse effect” increases air temperature and precipitation is false. (61)
The truth is that air temperature and precipitation both vary directly with the health of the ether.
From 2017 to 2019, the February snowfall record at California’s Squaw Valley ski area increased by an annual average of 29.8%.
From 2017 to 2019, California’s Squaw Valley ski resort’s February snowfall record increased by 59.6%, or by 117 inches, from an all-time high 196 inches to an all-time high 313 inches.
This statistic proves that Physicist John Tyndall’s 1856 theory that a Carbon Dioxide-driven “greenhouse effect” increases air temperature and precipitation is false. (62)
The truth is that air temperature and precipitation both vary directly with the health of the ether.
From 2017 to 2019, commencing during what at this writing is purported to be the hottest year in history, the 29.8% average annual increase in the February snowfall record at California’s Squaw Valley ski area was 277.2% greater, or almost four times greater than the 7.9% average annual increase in snowfall at Squaw from 2012-13 to 2018-19.
This statistic proves that Physicist John Tyndall’s 1856 theory that a Carbon Dioxide-driven “greenhouse effect” increases air temperature and precipitation is false. (63)
The truth is that air temperature and precipitation both vary directly with the health of the ether.
Snowfall in California is increasing hyper-exponentially because the health of the ether is inexorably improving, and both precipitation and air temperature vary directly with the health of the ether.
In 2017-18, during what is at this writing purported to be the second-hottest year in history, the overall winter temperature in North Dakota was 2.6 degrees colder than average.
The North Dakota Climate Bulletin described it as “cooler”, and said it was "the 55th warmest because of the nature of the distribution of temperatures”.
This statistic proves that Physicist John Tyndall’s 1856 theory that a Carbon Dioxide-driven “greenhouse effect” increases air temperature and precipitation is false. (64)
The truth is that air temperature and precipitation both vary directly with the health of the ether.
In 2017, during what is at this writing purported to be the second-hottest year in history, North Atlantic cooling decreased below 1950s (and 1800s) levels.
This statistic proves that Physicist John Tyndall’s 1856 theory that a Carbon Dioxide-driven “greenhouse effect” increases air temperature and precipitation is false. (65)
The truth is that air temperature and precipitation both vary directly with the health of the ether.
In 2017, during what is at this writing purported to be the second-hottest year in history, early November snow cover in North America was the highest in over a decade.
This statistic proves that Physicist John Tyndall’s 1856 theory that a Carbon Dioxide-driven “greenhouse effect” increases air temperature and precipitation is false. (66)
The truth is that air temperature and precipitation both vary directly with the health of the ether.
Early November snow cover in North America was the highest in over a decade in 2017 because the health of the ether is inexorably improving, and both precipitation and air temperature vary directly with the health of the ether.
In 2017, during what at this writing is purported to be the second hottest year in history, the low temperature in Santiago, Chile was 5 degrees below zero, Celsius, or 25 degrees Fahrenheit, the lowest in history.
This statistic proves that Physicist John Tyndall’s 1856 theory that a Carbon Dioxide-driven “greenhouse effect” increases air temperature and precipitation is false. (67)
The truth is that air temperature and precipitation both vary directly with the health of the ether.
In 2017, during what is at this writing in November 2025 is purported to have been the hottest year in history, California’s Squaw Valley ski resort set an all-time February snowfall record of 196 inches.
This statistic proves that Physicist John Tyndall’s 1856 theory that a Carbon Dioxide-driven “greenhouse effect” increases air temperature and precipitation is false. (68)
The truth is that air temperature and precipitation both vary directly with the health of the ether.
In January 2017, during what is at this writing purported to be the second-hottest year in history, Bismarck, North Dakota’s all-time record 53.1 inches of snow accumulation to January 2 was 7.7% greater than its 49.3 inches in 1993-1994.
This statistic proves that Physicist John Tyndall’s 1856 theory a Carbon Dioxide-driven “greenhouse effect” increases air temperature and precipitation is false. (69)
The truth is that air temperature and precipitation both vary directly with the health of the ether.
On May 18, 2017, record 11 inches of snow fell in Cheyenne, Wyoming, 120% greater than the previous record for the date of 5 inches set in 1915.
This statistic proves that Physicist John Tyndall’s 1856 theory a Carbon Dioxide-driven “greenhouse effect” increases air temperature and precipitation is false. (70)
The truth is that air temperature and precipitation both vary directly with the health of the ether.
Given that precipitation and air temperature both vary directly with the health of the ether, the health of the ether in Wyoming was the greatest in history in 2017.
In July 2017, during what is at this writing purported to be the second-hottest year in history, Santiago, Chile had snow for the first time since 2011. The last time it had snowed there prior to that was 2007.
This statistic proves that Physicist John Tyndall’s 1856 theory a Carbon Dioxide-driven “greenhouse effect” increases air temperature and precipitation is false. (71)
The truth is that air temperature and precipitation both vary directly with the health of the ether.
AccuWeather Senior Meteorologist Jason Nicholls said “So while snow in the capital is unusual, it is not unheard of."
He’s desperate to keep you from recognizing that it’s snowing in Santiago, Chile for the third time in a decade because the health of the ether is inexorably improving, and both precipitation and air temperature vary directly with the health of the ether.
Here’s a picture of Jason Nicholls.

(AccuWeather Senior Meteorologist Jason Nicholls)
I have included his picture so that you could get a better idea of what a generational Satanist Freemason of marginal influence looks like.
They are all related to one another through the maternal bloodline. Generational Satanists comprise between twenty and thirty percent of the populace, and are hiding in plain sight in every city, town and village on Earth. It’s how the few have controlled the many all the way back to Babylon, and before.
But they say that the hardest part of solving a problem is recognizing that you have one.
Don Croft used to say “Parasites fear exposure above all else”.
How long do you think that these people have left in power, now?
Please consider doing what you can to help speed the transition.
In September 2017, during what is at this writing in 2025 purported to be the hottest year in history, the U.K.’s Times said “We were wrong — worst effects of climate change can be avoided, say experts”.
The subhead reads “Scientists admit that world is warming more slowly than predicted”.
Where “warming more slowly” is Mil-speak for “rapidly cooling”.

(“Water? You mean, like in the toilet?” - From “Idiocracy”, written by Mike Judge, 2006)
In October 2017, during what is at this writing in November 2025 is purported to be the hottest year in history, the UK’s Guardian said “UK faces MONTHS of SNOW: Sinking polar vortex to trigger COLDEST winter since GREAT FREEZE”. The subhead of the article reads “BRITAIN is weeks away from the first major winter whiteout with 2017 shaping up to be the “year of the snowstorm”.
The statement that 2017 was the hottest year in history is false.
On Friday, November 3, 2017, during what is at this writing purported to be the hottest in history, Seattle, Washington recorded an all-time record 13.2 inches of snowfall.
This statistic proves that Physicist John Tyndall’s 1856 theory a Carbon Dioxide-driven “greenhouse effect” increases air temperature and precipitation is false. (72)
The truth is that air temperature and precipitation both vary directly with the health of the ether.
The assertion that 2017 was the hottest year in history is also false.
Given that both precipitation and air temperature vary directly with the health of the ether, this statistic shows that the health of the ether in Seattle Washington was at its highest level in history in 2017.
On November 8, 2017, during what is at this writing in November 2025 is purported to be the hottest year in history, over one-quarter of the area of the Lower 48 states had snow on the ground, the greatest percentage in history.
This proves that the statement that 2017 was the hottest year in history is false.
Given that precipitation and air temperature both vary directly with the health of the ether, this statistic documents that the health of the ether in the United States was at its highest level in history in 2017.
On December 8, 2017, during what is to this writing in November 2017 purported to be the hottest year in history, an all-time record seven inches of snow fell in Corpus Christi, Texas.
This statistic proves that Physicist John Tyndall’s 1856 theory a Carbon Dioxide-driven “greenhouse effect” increases air temperature and precipitation is false. (73)
The truth is that air temperature and precipitation both vary directly with the health of the ether.
In 2020, an uncredited article on kristv.com said in comment “Some scattered areas reported up to 7 inches of snow, although the official accumulation at Corpus Christi International Airport was reported at 1 inch”.
The National Weather Service’s downgrading of an actual 7 inches of snow by 85.7% to a fabricated 1 inch of snow is an example of the propaganda technique known as “stonewalling”.
The assertion that 2017 was the hottest year in history is false.
On December 8, 2017, kcci.com’s Abigail Elise said "Last time the city (of Corpus Christi, Texas - ed) saw snow was Christmas Eve 2004 and that was their greatest snowfall on record with 2.3 inches.
When, in fact, On December 24, 2004, 4.4 inches of snow fell in Corpus Christi, Texas.
Abigail’s downgrading of an actual 4.4 inches of snow by 47.7%, or by almost half to a fabricated 2.3 inches of snow is an example of the propaganda technique known as “stonewalling”.
I have exposed the duplicity of Abigail Elise and kcci.com by using what was known in the old days as “fact checking”.
Here’s Abigail (Elise) Kurten’s picture, in a Satanic-purple top, where she’s using her left hand to make a purportedly-secret Masonic “gesture of recognition”.

(Abigail (Elise) Kurten)
Now, here’s a picture of a Satanic-purple Masonic “thumb’s-up” greeing card which uses the same purportedly-secret “gesture of recognition” that Abigail is using in the photo immediately above.

(Masonic “thulmb’s-up” greeting card)
I have included her picture so that you could get a better idea of what a generational Satanist Freemason of marginal influence looks like.
In 2018-2019, there was at least 1 inch of snow on the ground in Caribou, Maine for 163 days, from Nov. 10 through April 21, the all-time record.
This statistic proves that Physicist John Tyndall’s 1856 theory that a Carbon Dioxide-driven “greenhouse effect” increases air temperature and precipitation is false. (74)
The truth is that air temperature and precipitation both vary directly with the health of the ether.
In 2018, surface and subsurface temperatures of the North Atlantic decreased to their lowest levels in in more than 30 years.
This statistic proves that Physicist John Tyndall’s 1856 theory that a Carbon Dioxide-driven “greenhouse effect” increases air temperature and precipitation is false.
The truth is that air temperature and precipitation both vary directly with the health of the ether.
In January 2018, yale.edu said “It’s Official: 2017 Was the Second-Hottest on Record”.
When, in fact, in 2017, North Atlantic cooling dropped below 1950s (and 1800s) levels.
Yale University’ statement that 2017 was the hottest year in history is false.
I have exposed their duplicity by using what was known in the old days as “fact checking”.
In 2019, weather.com’s Linda Lam falsely inflated the number of all-time state heat records in the United States by 50%, or by half, from two to three.
That is an example of the propaganda technique known as “stonewalling”.
In 2019, weather.com’s Linda claimed that a U.S. high temperature record had been set in Georgia in 2015.
When, in fact, it had not; the current Georgia state high temperature record was set in 1952.
I have exposed the duplicity of weather.com’s Linda Lam by using what was known in the old days as “fact checking”.
Here’s Linda Lam’s picture.

(weather.com’s Linda Lam)
I have included Linda Lam’s picture so that you could get a better idea of what a generational Satanist Freemason of marginal influence looks like.
They are all related to one another through the maternal bloodline. Generational Satanists comprise between twenty and thirty percent of the populace, and are hiding in plain sight in every city, town and village on Earth. It’s how the few have controlled the many all the way back to Babylon, and before.
But they say that the hardest part of solving a problem is recognizing that you have one.
Don Croft used to say “Parasites fear exposure above all else”.
How long do you think that these people have left in power, now?
Please consider doing what you can to help speed the transition.
In 2019, two all-time state cold temperature records were broken in the U.S.: one in Illinois, and the other in Hawaii.
In 2019, Sugar Bowl ski resort in California set an all-time record for February snowfall of 263 inches.
This statistic proves that Physicist John Tyndall’s 1856 theory that a Carbon Dioxide-driven “greenhouse effect” increases air temperature and precipitation is false. (75)
The truth is that air temperature and precipitation both vary directly with the health of the ether.
Given that precipitation and air temperature both vary directly with the health of the ether, this statistic documents that the health of the ether in California was at its highest level in history in 2019.
In 2019, the new January record for snowfall in Caribou, Maine was 34% above the previous record, set in 1991.
This statistic proves that Physicist John Tyndall’s 1856 theory that a Carbon Dioxide-driven “greenhouse effect” increases air temperature and precipitation is false. (76)
The truth is that air temperature and precipitation both vary directly with the health of the ether.
In 2019, the 19.5-degree average margin by which U.S. state cold records was broken was 129% greater, or well more than two times greater than their 8.5-degree average margin from 2009 to 2011.
This statistic proves that Physicist John Tyndall’s 1856 theory that a Carbon Dioxide-driven “greenhouse effect” increases air temperature and precipitation is false. (77)
The truth is that air temperature and precipitation both vary directly with the health of the ether.
In 2019, the two all-time state cold temperature records which were broken in the United States was 200% greater, or three times greater than the .5%-per-year average number of cold records broken per year from 2009 to 2019.
This statistic proves that Physicist John Tyndall’s 1856 theory that a Carbon Dioxide-driven “greenhouse effect” increases air temperature and precipitation is false. (78)
The truth is that air temperature and precipitation both vary directly with the health of the ether.
On January 31, 2019, the record low temperature for the state of Illinois of 38 degrees below zero at Mount Carroll, was 2 degrees lower than the previous record of 36 degrees below zero on January 5, 1999 in Congerville.
This statistic proves that Physicist John Tyndall’s 1856 theory that a Carbon Dioxide-driven “greenhouse effect” increases air temperature and precipitation is false. (79)
The truth is that air temperature and precipitation both vary directly with the health of the ether.
On January 31, 2019, the Illinois all-time cold state record decreased by 6%, from -36 on January 5, 1999 to -38 in 2019.
This statistic proves that Physicist John Tyndall’s 1856 theory that a Carbon Dioxide-driven “greenhouse effect” increases air temperature and precipitation is false. (80)
The truth is that air temperature and precipitation both vary directly with the health of the ether.
From February 11, 2019 to January 16, 2024, eleven randomly-selected low temperature records in the United States were broken by an average of 4.17 degrees.
From February 11, 2019 to January 16, 2024, twenty randomly-selected low temperature records decreased by an average of 4.09 degrees.
From February 11, 2019 to January 16, 2024, the average decrease of 4.09 degrees in twenty randomly-selected low temperature records was 35.6% greater, or more than one third greater than the average increase of 2.95 degrees in twenty randomly-selected high temperature records from July 1, 2021 to January 16, 2024.
Contrary to continuous, hysterical propaganda to the contrary, temperatures are decreasing exponentially, going forward in time.
This statistic proves that Physicist John Tyndall’s 1856 theory that a Carbon Dioxide-driven “greenhouse effect” increases air temperature and precipitation is false. (81)
The truth is that air temperature and precipitation both vary directly with the health of the ether.
From February 11, 2019 to January 16, 2024, 4.17-degree average decrease in eleven randomly-selected low temperature records was 67.5% greater, or more than two thirds greater than the 2.49-degree average increase in ten randomly-selected high temperature records from July 9, 2022 to July 17, 2023.
This statistic proves that Physicist John Tyndall’s 1856 theory that a Carbon Dioxide-driven “greenhouse effect” increases air temperature and precipitation is false. (82)
The truth is that air temperature and precipitation both vary directly with the health of the ether.
On February 11, 2019, the record low temperature of 10.4 degrees at the summit of Mauna Kea on the Island of Hawaii was 4.6 degrees lower than the previous record of 15 degrees on January 5, 1975.
This statistic proves that Physicist John Tyndall’s 1856 theory that a Carbon Dioxide-driven “greenhouse effect” increases air temperature and precipitation is false. (83)
The truth is that air temperature and precipitation both vary directly with the health of the ether.
On February 12, 2019, the Hawaii all-time state cold record decreased by 33.3% , or by one third, from 12 degrees on May 17, 1979 to 8 degrees on February 11, 2019.
Both coolweather.net and the weather channel have blacked out the 2019 Hawaii record.
Those are examples of the propaganda technique known as “stonewalling”.
This statistic proves that Physicist John Tyndall’s 1856 theory that a Carbon Dioxide-driven “greenhouse effect” increases air temperature and precipitation is false. (84)
The truth is that air temperature and precipitation both vary directly with the health of the ether.
May 2019 was Denver, Colorado’s wettest overall month in two years.
May 2019 was Denver’s coldest May in 24 years.
This statistic proves that Physicist John Tyndall’s 1856 theory that a Carbon Dioxide-driven “greenhouse effect” increases air temperature and precipitation is false. (85)
The truth is that air temperature and precipitation both vary directly with the health of the ether.
In January 2020, NASA said “2019 Was the Second Warmest Year On Record”.
When, in fact, in 2018-2019, there was at least 1 inch of snow on the ground in Caribou, Maine for 163 days, from Nov. 10 through April 21, the all-time record.
Further, May 2019 was Denver, Colorado’s coldest May in 24 years.
NASA’s claim in 2020 that 2019 was the second hottest year in history is false.
I have exposed the duplicity of NASA by using what was known in the old days as “fact checking”.
On January 15, 2020, noaa.gov said “NOAA finds ocean heat content was the highest in recorded history. Earth’s warming trend continued in 2019, making it the second-hottest year in NOAA’s 140-year climate record just behind 2016.”
When, in fact, in 2019, the two all-time state cold temperature records which were broken in the United States were 300% greater, or four times greater than the .5%-per-year average number of cold records broken per year from 2009 to 2019.
Further, in 2019, the 19.5-degree average margin by which all-time low state temperature records were broken in the United States was 129% greater, or well more than two times greater than their 8.5-degree average margin from 2009 to 2011.
And how could two of the four, or 50% of the all-time low state temperature records in the United States from 2009 to present be set in 2019?
It’s not true. It’s a gigantic, bald-faced lie. I have exposed the duplicity of NOAA by using what was known in the old days as “fact checking”.
From July 1, 2021 to May 10, 2024 the average increase in twenty randomly-selected high temperature records was 2.72 degrees.
From July 1, 2021 to May 10, 2024, ten randomly-selected high temperature records were broken by an average of 2.95 degrees.
From July 1, 2021 to May 10, 2024, the 2.95-degree average decrease of ten randomly-selected U.S. low temperature records was 7.4% greater than the 2.72-degree average decrease of ten randomly-selected low temperature records.
This statistic proves that Physicist John Tyndall’s 1856 theory that a Carbon Dioxide-driven “greenhouse effect” increases air temperature and precipitation is false. (86)
The truth is that air temperature and precipitation both vary directly with the health of the ether.
On December 4, 2021, the record low temperature in Honolulu, Hawaii for the date of 56 degrees was 3 degrees lower than the previous record of 59 degrees from 1962.
This statistic proves that Physicist John Tyndall’s 1856 theory that a Carbon Dioxide-driven “greenhouse effect” increases air temperature and precipitation is false. (87)
The truth is that air temperature and precipitation both vary directly with the health of the ether.
On December 4, 2021, the record low temperature of 71 degrees in Hilo, Hawaii for the date was 3 degrees lower than the previous record of 74 degrees in 1971.
This statistic proves that Physicist John Tyndall’s 1856 theory that a Carbon Dioxide-driven “greenhouse effect” increases air temperature and precipitation is false. (88)
The truth is that air temperature and precipitation both vary directly with the health of the ether.
From 2022 to 2024, the 4-degree average annual decrease of ten randomly-selected U.S. low temperature records was 47% greater, or almost half again greater than their 2.72-degree decrease from 2021 to 2022.
This statistic proves that Physicist John Tyndall’s 1856 theory that a Carbon Dioxide-driven “greenhouse effect” increases air temperature and precipitation is false. (89)
The truth is that air temperature and precipitation both vary directly with the health of the ether.
From 2022 to 2023, Denver, Colorado’s all-time low temperature record for February 23 decreased by 36.3%, or by more than one third, from -7 degrees Fahrenheit to -11 degrees Fahrenheit.
This statistic proves that Physicist John Tyndall’s 1856 theory that a Carbon Dioxide-driven “greenhouse effect” increases air temperature and precipitation is false. (90)
The truth is that air temperature and precipitation both vary directly with the health of the ether.
From 2022 to 2023, the 36.3% decrease in Denver, Colorado’s all-time low temperature for February 23 was 8,975% greater, or more than ninety times greater than its .4% average annual decrease from 1899 to 2022.
This statistic proves that Physicist John Tyndall’s 1856 theory that a Carbon Dioxide-driven “greenhouse effect” increases air temperature and precipitation is false. (91)
The truth is that air temperature and precipitation both vary directly with the health of the ether.
On January 14, 2022, nhm.ac.uk said “The last eight years have been the hottest on record, according to NASA”.
When, in fact, 50%, or half of the all-time high state temperature records set in the United States from 2006 to 2025 were set in years outside of the eight years from 2014 to 2021.
Further, from 2009 to 2025, the four all-time low U.S. state temperature records were 100% greater, or two times greater than the two all-time high state temperature records from 2006 to 2025.
Further still, from 2009 to 2025, the 14% average decrease in the four all-time low state temperature records set in the United States was 1,455% greater, or more than fifteen times greater than that the .9 degree average increase in the two all-time high temperature state record set from 2006 to 2025.
NASA’s statement that the last eight years have been the hottest on record is false.
I have exposed the duplicity of the U.K.'s Natural History Museum and NASA by using what was known in the old days as “fact checking”.
From February 23, 2022 to January 9, 2024, ten randomly-selected U.S. cold records were broken by an average of 4 degrees.
From July 1, 2021 to May 10, 2024, the 2.95-degree average decrease of ten randomly-selected U.S. low temperature records was 7.4% greater than the 2.72-degree average decrease of ten randomly-selected low temperature records.
This statistic proves that Physicist John Tyndall’s 1856 theory that a Carbon Dioxide-driven “greenhouse effect” increases air temperature and precipitation is false. (92)
The truth is that air temperature and precipitation both vary directly with the health of the ether.
From February 23, 2022 to January 9, 2024, the 4-degree average margin in ten randomly-selected low temperature records was 35.6% greater, or more than one third greater than the 2.95-degree average margin in ten randomly-selected high temperature records from July 9, 2022 to July 17, 2023.
This statistic proves that Physicist John Tyndall’s 1856 theory that a Carbon Dioxide-driven “greenhouse effect” increases air temperature and precipitation is false. (93)
The truth is that air temperature and precipitation both vary directly with the health of the ether.
Contrary to continuous propaganda to the contrary, temperatures are decreasing exponentially, going forward in time.
On February 23, 2022, Denver, Colorado set a new all-time low temperature record for the date, at -7 degrees Fahrenheit.
This statistic proves that Physicist John Tyndall’s 1856 theory that a Carbon Dioxide-driven “greenhouse effect” increases air temperature and precipitation is false. (94)
The truth is that air temperature and precipitation both vary directly with the health of the ether.
From July 9, 2022 to July 17, 2023, ten randomly-selected U.S. high temperature records were broken by an average of 2.49 degrees.
July 9, 2022, the record high temperature of 100 degrees for Denver, Colorado for the date was 2 degrees higher than the previous record of 98 degrees set on July 9 in a year obfuscated by the National Weather Service.
On January 30, 2023, the record low temperature of minus 9 degrees Fahrenheit in Providence, Rhode Island for the date was 7 degrees lower than the previous record of minus 2 degrees Fahrenheit from January 3, 1918.
On February 23, 2023, Denver, Colorado set a new all-time low temperature record for the date, at -11 degrees Fahrenheit.
This statistic proves that Physicist John Tyndall’s 1856 theory that a Carbon Dioxide-driven “greenhouse effect” increases air temperature and precipitation is false. (95)
The truth is that air temperature and precipitation both vary directly with the health of the ether.
On July 8, 2023, the record high temperature in Tulsa, Oklahoma for the date of 105 degrees was 6 degrees higher than the previous record of 99 degrees set on some prior date obfuscated by USA Today.
On July 17, 2023, the record high temperature in Grand Junction, Colorado for the date of 107 degrees was 3 degrees higher than the prior record of 104 degrees set on some obfuscated prior date.
On July 17, 2023, the record high temperature in El Paso, Texas for the date of 109 degrees was 3 degrees higher than the previous record of 106 degrees on July 17, 1980.
On July 17, 2023, the record high temperature in Casper, Wyoming for the date of 101 degrees was 2 degrees higher than the the previous record of 99 degrees from July 17, 1977.
In 2024, four randomly-selected high temperature records increased by an annual average 2.2 of degrees.
In 2024, five randomly-selected low temperature records decreased by an annual average of 4.42 degrees.
In 2024, the 4.42-degree average decrease in five randomly-selected low temperature records was 100.9% greater, or two times greater than the 2.2-degree average increase of four randomly-selected high temperature records.
This statistic proves that Physicist John Tyndall’s 1856 theory that a Carbon Dioxide-driven “greenhouse effect” increases air temperature and precipitation is false. (96)
The truth is that air temperature and precipitation both vary directly with the health of the ether.
On January 6, 2024, the all-time record low temperature in Oslo, Norway of 31.1 degrees below zero was 5.1 degrees lower than the previous record of 26 degrees below zero on January 19, 1941.
Arabaiaweather.com omitted the previous record, the date on which it was set, and the margin between the old record and the new.
Those are all examples of the propaganda technique known as “stonewalling”.
This statistic proves that Physicist John Tyndall’s 1856 theory that a Carbon Dioxide-driven “greenhouse effect” increases air temperature and precipitation is false. (97)
The truth is that air temperature and precipitation both vary directly with the health of the ether.
On January 15, 2024, the record low temperature in Kansas City, Missouri for the date of 16 degrees below zero was 6 degrees lower than the previous record of 10 degrees below zero on some obfuscated prior date.
I had to look up another article to learn that it was 1979.
KCTV5.com’s Gabe Schwartz omitted the magnitude of the decrease between the old record and the new, and described it only-generally as “smashed”.
Those are examples of the propaganda technique known as “stonewalling”.
This statistic proves that Physicist John Tyndall’s 1856 theory that a Carbon Dioxide-driven “greenhouse effect” increases air temperature and precipitation is false. (98)
The truth is that air temperature and precipitation both vary directly with the health of the ether.
On January 16, 2024, the record low temperature for the date of 18 degrees Fahrenheit in Houston, Texas was 3 degrees lower than the previous record of 22 degrees on January 16, 1972.
This statistic proves that Physicist John Tyndall’s 1856 theory that a Carbon Dioxide-driven “greenhouse effect” increases air temperature and precipitation is false. (99)
The truth is that air temperature and precipitation both vary directly with the health of the ether.
On January 15, 2024, the record low high temperature in Kansas City, Missouri for the date of 1 degree was 5 degrees lower than the previous record of 6 degrees in 1972.
This statistic proves that Physicist John Tyndall’s 1856 theory that a Carbon Dioxide-driven “greenhouse effect” increases air temperature and precipitation is false. (100)
The truth is that air temperature and precipitation both vary directly with the health of the ether.
On February 26, 2024, the record high temperature in Laredo, Texas for the date of 97 degrees was 1 degree higher than the previous record of 96 degrees on February 26, 1986.
On March 3, 2024, the record high temperature for the date in Central Park in New York of 68 degrees was 3 degrees higher than the previous record of 65 degrees on March 3, 1991.
On April 23, 2024, the record low temperature of 68 degrees at Hilo, Hawaii was 3 degrees lower than the previous record of 71 degrees set in 1971.
This statistic proves that Physicist John Tyndall’s 1856 theory that a Carbon Dioxide-driven “greenhouse effect” increases air temperature and precipitation is false. (101)
The truth is that air temperature and precipitation both vary directly with the health of the ether.
On April 29, 2024, the record high temperature in Millersville, Pennsylvania for the date of 90 degrees was 3 degrees higher than the previous record of 87 on April 29, 1974.
On May 9, 2024, the record high temperature in Laredo, Texas for the date of 109 degrees was 1 degree higher than the previous record of 108 in 2011.
On May 9, 2024, the record high temperature in Puebla, Mexico for the date of 35.2 degrees Centigrade was .9 degree higher than the previous record of 34.3 on May 9, 1947.
In 2025, climate-change-guide.com said “In fact, 2016 was the hottest year ever recorded.”
When, in fact, the only two all-time high state temperature records set in the United States from 2000 to present were set in 2006 and in 2012.
Climate Change Guide’s claim that 2016 was the hottest year in history is false.
I have just exposed the duplicity of climate-change-guide.com by using what was known in the old days as “fact checking”.
Given that efforts to memory-hole myself and my material will be ongoing, I thought I’d begin including pictures of myself with my articles, so that they are part of the record.
Don Croft always used to say that keeping a high public profile was important, and always underscored the impact that one person of conscience can have within the bigger picture.
The photo below is from Honolulu from 2022.

(Jeff Miller at Kaiser’s on Oahu’s South shore, April 2022)
Jeff Miller, Hilo, HI, November 14, 2025
If you’d like to be added to this free mailing list, or know someone who would be, please send me a note at [email protected].