EXPONENTIAL INCREASES IN BICYCLING REGARDLESS OF CULTURE OR GEOGRAPHY
From “Positive Changes That Are Occurring”, by Jeff Miller, published 7/2021, revised 7/23.
“As long as I breathe, I attack”
- Cyclist Bernard Hinault

(Bernard Hinault, 1985)
(Bernard Hinault, 2018)
Great positive changes are underway at every level of our reality. They began in earnest in 2012, and have been increasing in speed and magnitude. I began writing this series of articles, entitled “Positive Changes That Are Occurring”, in July of 2013.
These historically-unprecedented positive changes are being driven by the exponentially improving health of the ether. One of the drivers of that improvement is many hundreds of thousands, if not millions of simple, inexpensive Orgonite devices based on the work of Wilhelm Reich and Karl Hans Welz.
Since Don Croft first fabricated tactical Orgonite in 2000, its widespread, ongoing and ever-increasing distribution has been unknitting and transforming the ancient Death energy matrix built and expanded by our dark masters, well, all the way back to Babylon, and before. And, as a result, the Ether is returning to its natural state of health and vitality.
One of those changes is that bicycling is increasing exponentially, regardless of culture or geography.
That’s because moral and mental health vary directly with that of the subject’s etheric environment.
I once read an article where a Native American said “the bicycle is the white man’s greatest invention”. As a white man, I have to concur. That and the Frisbee.
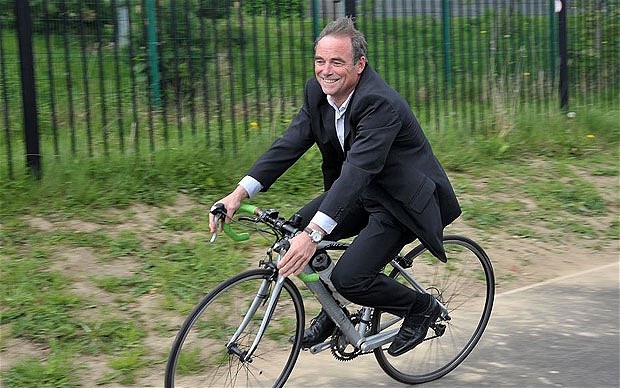
I’ve been riding my bike on the street since I was a kid. We all did, back then, but most gave it up when they started driving. But not me. In 1984, when I was 20, my buddy, Steve, and I, would ride our mountain bikes around San Francisco, side-by-side in traffic at high speed, like motorcycle cops. Not many people of any age rode bikes at that time. It was bike messengers and us, and a few road guys. Drivers were often actively hostile to cyclists.
And that’s the way it stayed, all the way to four or five years ago. I personally witnessed the transformation, and started talking about as it happened. Suddenly, everyone was out on a bike. At once. And, at the same time, we even began seeing young women on motorcycles, and have been since. That’s something that you really didn’t even see when I was young, in the 70’s, when motorcycles were hot. Certainly not as many as now.
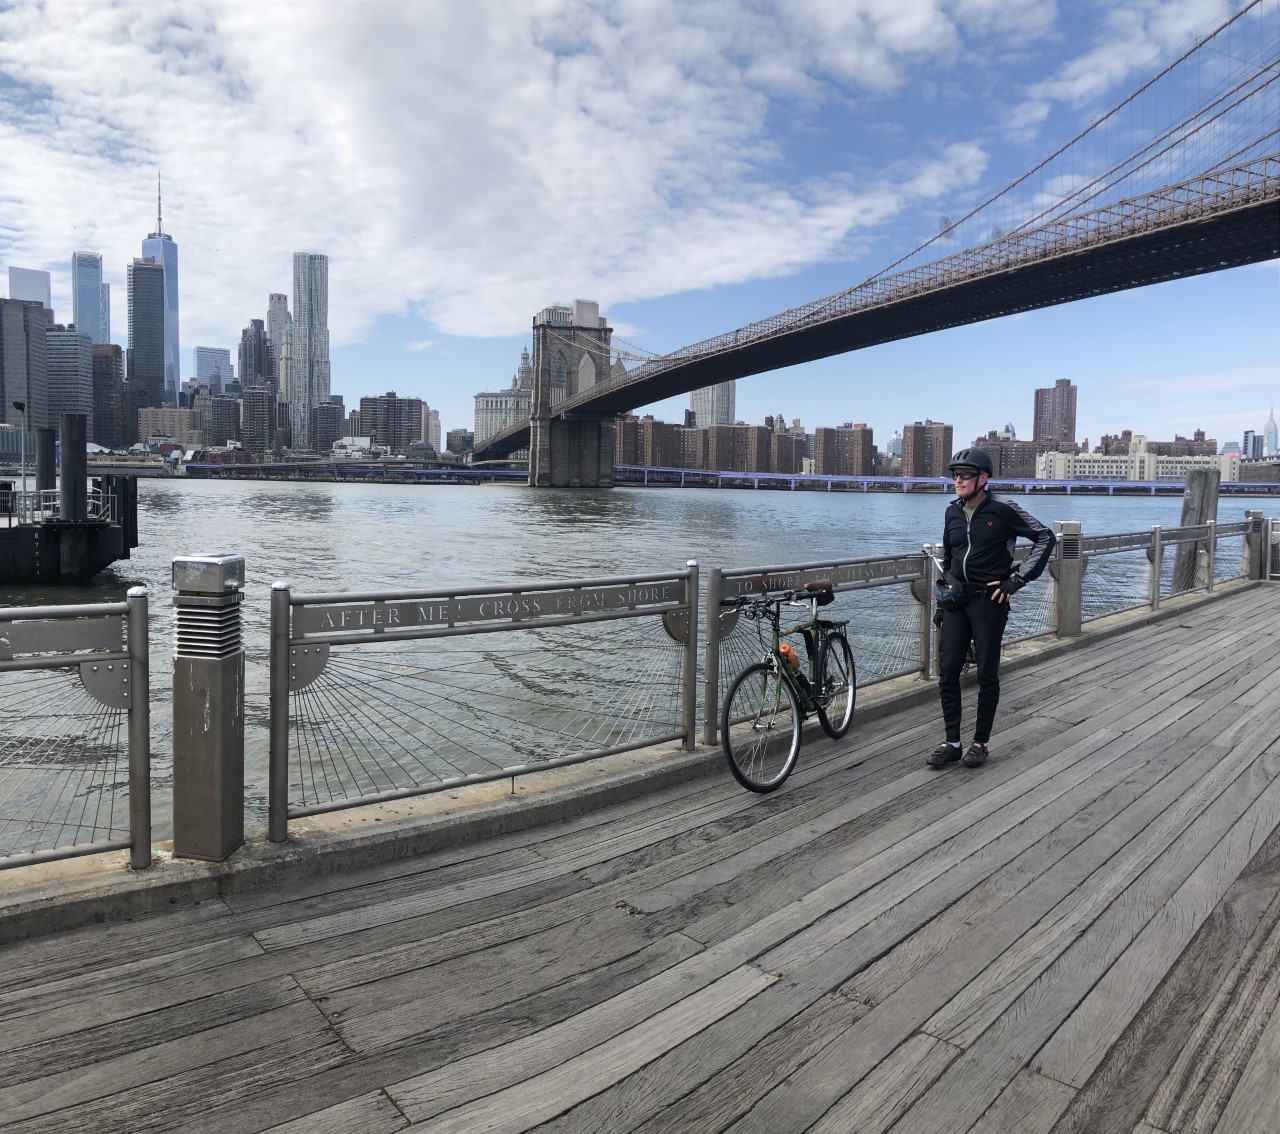
(Jeff Miller, Brooklyn, New York, 2020)
In 2019, I met a guy at the Park Slope Food Co-Op in Brooklyn. He was parking bikes, I was riding by, we got to talking. I learned that he was from Pittsburgh (where I lived from 2010 to 2018), and now lives in Park Slope. He agreed that the transformation was instantaneous in New York and Pittsburgh, and said he could testify that it happened at the same time in both places.
Here’s a picture of the amazing bike lanes in New York:
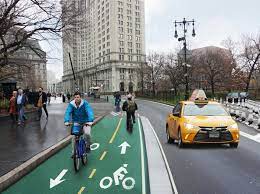
(Bike lanes, Manhattan, 2019)
THE DATA
From 1999 to 2018, cycling in London, England increased by 300%, or quadrupled.
From 2002 to 2022, miles cycled annually in England increased by 45%, from 38 to 55. Globalcyclingnetwork.com’s James Howell-Jones withheld the percentage, and described it as “rises steadily”.
He did that because “rises steadily” general, and also a thinly-veiled reference to the Atonist Black sun cult which has ruled things in all the nations, under various names and guises, all the way back to Babylon, and before.
James didn’t mention that the exponential increase in cycling in England was part of a wider trend taking place regardless of culture or geography. That’s an example of the propaganda technique known as “compartmentalization”.
From 2004 to 2016, sub-five mile journeys taken by cycling or walking in England decreased by 2.6%, from 38% to 37%. Then, from 2016 to 2021, they increased by 27%, from 37% to 47%.
Globalcyclingnetwork.com’s James Howell-Jones said “since the government began recording these figures in 2002, the number of bike trips has been steady”, to brazenly obscure the sudden, exponential increase in cycling which began in England in 2016.
From 2006 to 2016, the percentage of the Cabbagetown neighborhood in Toronto that was biking to work increased by 287%, or almost tripled.
From February 2013 to January 2014, cycle movements in Auckland, New Zealand increased by 8.1%, year-over-year, to 887,691.
From February 2013 to January 2014 versus February 2021 to January 2022, year-over-year cycle movements in Auckland, New Zealand increased by 260%, or headed toward quadrupled, from 887,691 to 3.2 million.
From February 2013 to January 2014 vs. February 2021 to January 2022, the long-term year-over-year average annual increase in cycle movements in Auckland, New Zealand was 32.5%, from 887,691 to 3.2 million.
From February 2013 to January 2014 vs. February 2021 to January 2022, the long-term year-over-year average monthly increase in cycle movements in Auckland, New Zealand was 2.7%.
From March 2013 to February 2014, cycle movements in Auckland, New Zealand increased by 7.2%, year-over-year, to 887,203.
From April 2013 to March 2014, cycle movements in Auckland, New Zealand increased by 6.6%, year-over-year, to 895,165.
From May 2013 to April 2014, cycle movements in Auckland, New Zealand increased by 7.05%, year-over-year, to 897,039.
From June 2013 to May 2014, cycle movements in Auckland, New Zealand increased by 8.8%, to 909,234.
From July 2013 to June 2014, cycle movements in Auckland, New Zealand increased by 9.6%, to 915,458.
From August 2013 to July 2014, cycle movements in Auckland, New Zealand increased by 5.7%, to 900,543.
From September 2013 to August 2014, cycle movements in Auckland, New Zealand increased by 4.8%, to 895,468.
From October 2013 to September 2014, cycle movements in Auckland, New Zealand increased by 5.4%, to 899,251.
From November 2013 to October 2014, cycle movements in Auckland, New Zealand increased by 2.3%, year-over-year, to 891,245.
In December 2013 to November 2014, cycle movements in Auckland, New Zealand increased by .2%, year-over-year, to 883,031.
From 2014 to 2022, the number of German residents who did a cycling trip increased by 35%, from 4.0 million to 5.4 million.
From 2014 to 2022, the average annual increase in the number of Germans who did a cycling trip was 4.4%.
From January 2014 to December 2014, cycle movements in Auckland, New Zealand decreased by .8%, year-over-year, to 881,620.
In January 2014, there were 887,691 cycle movements in Auckland, New Zealand.
From February 2014 to January 2015, cycle movements in Auckland, New Zealand increased by .9%, year-over-year, to 895,586.
From February 2014 to January 2015, the 0.9% year-over-year increase in cycle movements in Auckland, New Zealand was 88.8% less than their 8.1% year-over-year increase from February 2013 to January 2014.
From March 2014 to February 2015, cycle movements in Auckland, New Zealand increased by 1.5%, year-over-year, to 900,531.
From April 2014 to March 2015, cycle movements in Auckland, New Zealand increased by .8%, year-over-year, to 902,343.
From May 2014 to April 2015, cycle movements in Auckland, New Zealand increased by .9%, year-over-year, to 904,901.
From June 2014 to May 2015, cycle movements in Auckland, New Zealand decreased by .8%, year-over-year, to 902,343.
From July 2014 to June 2015, cycle movements in Auckland, New Zealand decreased by 1%, year-over-year, to 906,518.
From August 2014 to July 2015, cycle movements in Auckland, New Zealand increased by 1.2%, year-over-year, to 911,350.
From September 2014 to August 2015, cycle movements in Auckland, New Zealand increased by 2.26%, year-over-year, to 915,664.
From October 2014 to September 2015, cycle movements in Auckland, New Zealand increased by 2.27%, year-over-year, to 919,703.
From November 2014 to October 2015, cycle movements in Auckland, New Zealand increased by 3.7%, year-over-year, to 924,286.
From December 2014 to November 2015, cycle movements in Auckland, New Zealand increased by 5.6%, year-over-year, to 911,350.
From January to December 2015 to January to December 2016, cycle movements in Auckland, New Zealand increased by 84%, or close to doubled, from 911,350 to 1.68 million.
From January 2015 to December 2015, cycle movements in Auckland, New Zealand increased by 7.4%, year-over-year, to 946,749.
In January 2015, cycling movements in Auckland, New Zealand increased by 16.4%, year-over-year.
From February 2015 to January 2016, cycle movements in Auckland, New Zealand increased by 5.1%, year-over-year, to 941,166.
From February 2015 to January 2016, the 5.1% year-over-year increase in cycle movements in Auckland, New Zealand was 466% greater, or heading toward six times greater than their 0.9% average annual increase from February 2014 to February 2015.
From March 2015 to February 2016, cycle movements in Auckland, New Zealand increased by 5.2%, year-over-year, to 947,413.
From April 2015 to March 2016, cycle movements in Auckland, New Zealand increased by 5.7%, year-over-year, to 954,153.
From May 2015 to April 2016, cycle movements in Auckland, New Zealand increased by 7.2%, year-over-year, to 946,749.
From August 2015 to July 2016, cycle movements in Auckland, New Zealand increased by 8.1%, year-over-year, to 1,710,000.
From May 2015 to July 2016 vs. August 2015 to July 2016, cycle movements in Auckland, New Zealand increased by 80.6%, or almost doubled, from 946,749 to 1,710,000. That’s a month-over-month increase of 763,251 cycle movements.
From September 2015 to August 2016, cycle movements in Auckland, New Zealand increased by 8.8%, year-over-year, to 1,610,000.
From September to October 2015, cycle movements in the city center of Auckland New Zealand increased by 23%, from 1,610,000 to 1,750,000.
From October 2015 to September 2016, cycle movements in Auckland, New Zealand increased by 8.8%, year-over-year, to 1.66 million.
From October 2015 to September 2016, 1.75 million cycle movements were recorded cycle movements in the city center of Auckland, New Zealand.
From November 2015 to October 2016, cycle movements in Auckland, New Zealand increased by 8.9%, year-over-year, to 1.67 Million.
From November 2015 to October 2016, the 1.76 million cycle movements recorded in the city center of Auckland, New Zealand were .6% greater than the 1.75 million cycle movements there from October 2015 to September 2016.
From November 2015 to October 2016, 1.76 million cycle movements were recorded in the city center of Auckland, New Zealand.
From December 2015 to November 2016, cycle movements in Auckland, New Zealand increased by 8.5%, year-over-year, to 1.67 million.
From December 2015 to November 2016, there were 1.77 million cycle movements in the city center of Auckland, New Zealand.
From 2016 to 2021, sub-five mile journeys taken by cycling or walking in England increased by 27%, from 37% to 47%.
From January to December 2016 to January to December 2017, cycle movements in Auckland, New Zealand increased by 8.8%, from 1.68 million to 1.827 million.
In 2016, bicycle commuting in Toronto, Canada increased by 34%.
From January to December 2016, cycle movements in Auckland, New Zealand increased by 7.2%, year-over-year, to 1.68 million.
From January to December 2016, there were 1.76 million cycle movements in the city center of Auckland, New Zealand.
In January 2016, cycle movements in Auckland, New Zealand decreased by 5.3%, year-over-year.
From February 2016 to January 2017, cycle movements in Auckland, New Zealand increased by 8.8%, year-over-year, to 1.700 million.
From February 2016 to January 2017, the 8.8% year-over-year increase in cycle movements in Auckland, New Zealand was 72.5% greater, or heading toward double their 5.1% year-over-year increase from February 2015 to January 2016.
From February 2016 to January 2017, there were 1.764 million cycle movements in the city center of Auckland, New Zealand
In February 2016, cycle movements in Auckland, New Zealand increased by 6.4%, year-over-year.
In February 2016, cycle movements in the center city of Auckland, New Zealand increased by 1.8%, year-over-year, to 164,346.
From March 2016 to February 2017, cycle movements in Auckland, New Zealand increased by 8.8%, year over year, to 1.710 million.
From March 2016 to February 2017, there were 1.761 million cycle movements in the city center of Auckland, New Zealand.
In March 2016, cycle movements in Auckland, New Zealand increased by 7.0%, year-over-year.
From April 2016 to March 2017, there were 1.752 million cycle movements in the city center of Auckland, New Zealand.
From April 2016 to March 2017, cycle movements in Auckland, New Zealand increased by 8.6%, to 1.716 million.
In April 2016, cycle movements in Auckland, New Zealand increased by 19.3%, year-over-year, to 946,749.
From May 2016 to April 2017, cycle movements in Auckland, New Zealand increased by 6.8%, year-over-year, to 1.713 million.
In May 2016, cycle movements in Auckland, New Zealand increased by 22.6%, year-over-year.
From June 2016 to May 2017, cycle movements in Auckland, New Zealand increased by 6.4%, year-over-year, to 1.727 million.
From June 2016 to May 2017, there were 1.746 million cycle movements in the city center of Auckland, New Zealand.
In June 2016, cycle movements in Auckland, New Zealand increased by 15.1%, year-over-year.
In July 2016, cycle movements in Auckland, New Zealand increased by 11.3%, year-over-year, to 110,822.
From July 2016 to October 2023, monthly cycle movements in Auckland, New Zealand increased by 145.6%, or well more than doubled, from 110,822 to 272,198.
From July 2016 to October 2023, monthly cycle movements in Auckland, New Zealand increased by a monthly average of 1.7%.
From July 2016 to June 2017, cycle movements in Auckland, New Zealand increased by 6.8%, year-over-year, to 1.742 million.
From July 2017 to June 2017, there were 1.761 million cycle movements in the city center of Auckland, New Zealand.
From July 2016 to August 2016, cycling movements in the city center of Auckland, New Zealand increased by 13%, from 115,518 to 130,523.
In July 2016, 115,518 cycle movements were recorded in the city center of Auckland, New Zealand.
From August 2016 to July 2017, cycle movements in Auckland, New Zealand increased by 6.3%, year-over-year, to 1.746 million.
From August 2016 to July 2017, there were 1.762 million cycle movements in the city center of Auckland, New Zealand.
From August to September 2016, cycle movements in the city center of Auckland, New Zealand decreased by 6%, from 130,523 to 122,697.
In August 2016, cycle movements at 14 regional count sites in Auckland, New Zealand increased by 13.9%, year-over-year, to 123,388.
In August 2016, 130,523 cycle movements were recorded in the city center of Auckland, New Zealand.
From September 2016 to August 2017, cycle movements in Auckland, New Zealand increased by 5.9%, year-over-year, to 1.755 million.
From September 2016 to August 2017, there were 1.770 million cycle movements in the city center of Auckland, New Zealand.
From September 2016 to October 2016, cycle movements in the city center of Auckland, New Zealand increased by 17.4%, from 122,679 to 144,017.
In September 2016, 122,697 cycle movements were recorded in the city center of Auckland, New Zealand.
From October 2016 to September 2017, cycle movements in Auckland, New Zealand increased by 6.1%, year-over-year, to 1.764 million.
From October 2016 to September 2017, there were 1.774 million cycle movements in the city center of Auckland, New Zealand.
In October 2016, 144,017 cycle movements were recorded in the city center of Auckland, New Zealand.
In October 2016, cycle movements in Auckland, New Zealand increased by 7%, year-over-year, to 145,039.
October 2016, there were 145,039 cycle movements in Auckland, New Zealand.
From October to November 2016, cycle movements in the city center of Auckland, New Zealand increased by 2.5%, from 144,017 to 147,648.
From November 2016 to October 2017, cycle movements in Auckland, New Zealand increased by 5.7%, year-over-year, to 1.768 million.
From November 2016 to October 2017, there were 1.777 million cycle movements in the city center of Auckland, New Zealand.
In November 2016, 147,648 cycle movements were recorded in the city center of Auckland, New Zealand.
In November 2016, cycle movements in the city center of Auckland, New Zealand increased by 12.8%, year-over-year, to 147,468.
From December 2016 to November 2017, cycle movements in Auckland, New Zealand increased by 7%, year-over-year, to 1.796 million.
From December 2016 to November 2017, cycle movements in the city center of Auckland, New Zealand increased by 1.3%, year-over-year, to 1.806 million.
In December 2016, cycle movements in the city center of Auckland, New Zealand increased by 12.4%, year-over-year, to 145,826.
In December 2016, cycle movements in Auckland, New Zealand increased by 2.9%, year-over-year, to 145,097.
From 2017 to 2022, e-bike usage in Germany as a percentage of total bicycling in Germany increased by 111%, or more than doubled, from 18% to 38%.
The uncredited Intelligence operative from eurovelo.com withheld the percentage, saying only that e-bikes in Germany were “slightly shrinking”.
From January to December 2017, cycle movements in the city center of Auckland, New Zealand increased by 3.7%, year-over-year, to 1.827 million.
From January to December 2017 to January to December 2018, cycle movements in Auckland, New Zealand increased by 94%, or almost doubled, from 1.827 million to 3.546 million.
From January to December 2017, cycle movements in Auckland, New Zealand increased by 7.9%, year-over-year to 1.818 million.
In January 2017, cycle movements in the city center of Auckland, New Zealand increased by 1.3%, to 162,055.
In January 2017, cycle movements in Auckland, New Zealand increased by 9.6%, year-over-year.
From February 2017 to January 2018, cycle movements in the city center of Auckland, New Zealand increased by 3.7%, year-over-year, to 1.829 million.
From February 2017 to January 2018, cycle movements in Auckland, New Zealand increased by 6.8%, year-over-year, to 1.815 million.
From February 2017 to January 2018, the 6.8% year-over-year increase in cycle movements in Auckland, New Zealand was 22.7% less than their 8.8% year-over-year increase from February 2016 to January 2018.
In February 2017, cycle movements in Auckland, New Zealand increased by 6.7%, year-over-year, to 170,452.
From March 2017 to February 2018, cycle movements in Auckland, New Zealand increased by 5.6%, year-over-year.
From March 2017 to February 2018, cycle movements in the city center of Auckland, increased by 3.7%, to 1.826 million.
In March 2017, cycle movements in Auckland, New Zealand increased by 3.6%, year-over-year, to 172,272.
In March 2017, cycle movements in the city center of Auckland, New Zealand decreased by 4.8%, year-over-year (“note that the Lightpath was closed from 1-7 March”).
From April 2017 to March 2018, cycle movements in Auckland, New Zealand increased by 6.0%, year-over-year, to 1.818 million.
From April 2017 to March 2018, cycle movements in the city center of Auckland, increased by 5.4%, year-over-year, to 1.846 million.
In April 2017, cycle movements in Auckland, New Zealand decreased by 1.4%, to 154,645.
From May 2017 to April 2018, cycle movements in the city center of Auckland, New Zealand increased by 6.7%, year-over-year, to 1.853 million.
From May 2017 to April 2018, cycle movements in Auckland, New Zealand increased by 5.9%, year-over-year, to 1.815 million.
In May 2017, cycle movements in Auckland, New Zealand increased by 9.2%, year-over-year, to 154,342.
In May 2017, cycle movements in the city center of Auckland, New Zealand increased by 6.0%, year-over-year, to 162,628.
From June 2017 to May 2018, cycle movement in the city center of Auckland, New Zealand increased by 6.4%, year-over-year, to 1.858 million.
From June 2017 to May 2018, cycle movements in Auckland, New Zealand increased by 5.3%, year-over-year, to 1.818 million.
In June 2017, cycle movements in Auckland, New Zealand increased by 13.3%, year-over-year, to 134,026.
In June 2017, cycle movements in the city center of Auckland, New Zealand increased by 12.3%, year-over-year, to 136,138.
From July 2017 to June 2018, cycle movements in the city center of Auckland, New Zealand increased by 4.8%, year-over-year, to 1.845 million.
From July 2017 to June 2018, cycle movements in Auckland, New Zealand increased by 3.7%, to 1.807 million.
In July 2017, cycle movements in the city center of Auckland, New Zealand increased by .9%, year-over-year, to 117,602.
In July 2017, cycle movements in Auckland, New Zealand increased by 3.7%, year-over-year, to 114,871.
From August 2017 to July 2018, cycle movements in Auckland, New Zealand increased by 5.2%, to 3.496 million.
From August 2017 to July 2018, the 3.496 million cycle movements in Auckland, New Zealand were 93.5% greater, or almost double the 1.807 million cycle movements there from July 2017 to January 2018.
In August 2017, cycle movements in the city center of Auckland, New Zealand increased by 6.1%, year-over-year to 139,785.
In August 2017, cycle movements in Auckland, New Zealand increased by 6.8%, year-over-year, to 131,751.
From September 2017 to August 2018, cycle movements in Auckland, New Zealand increased by 4.9%, year-over-year, to 3.501 million.
In September 2017, cycle movements in Auckland, New Zealand increased by 8.0%, year-over-year, to 128,665.
In September 2017, cycle movements in the city center of Auckland, New Zealand increased by 3.8%, year-over-year, to 128,519.
From October 2017 to September 2018, cycle movements in Auckland, New Zealand increased by 5.6%, year-over-year, to 3.539 million.
In October 2017, cycle movements in the city center of Auckland, New Zealand increased by 1.6%, year-over-year, to 147,516.
In October 2017, cycle movements in Auckland, New Zealand increased by 2.8%, year-over-year, to 149,140.
From November 2017 to October 2018, cycle movements in Auckland, New Zealand increased by 6.8%, year-over-year, to 3.587 million.
In November 2017, the 19.4% year-over-year increase in cycle movements in the city center of Auckland, New Zealand was 592% greater, or almost seven times greater than their 2.8% year-over-year increase in October 2017.
In November 2017, cycle movements in the city center of Auckland, New Zealand increased by 19.4%, year-over-year, to 177,574.
In November 2017, cycle movements in Auckland, New Zealand increased by 18.9%, year-over-year, to 172,888.
From December 2017 to November 2018, cycle movements in Auckland, New Zealand increased by 4.7%, year-over-year, to 3.574 million.
In December 2017, cycle movements in the city center of Auckland, New Zealand increased by 14.5%, year-over-year, to 166,919.
In December 2017, cycle movements in Auckland, New Zealand increased by 14.9%, year-over-year, to 168,452.
From January to December 2018, cycle movements in Auckland, New Zealand increased by 2.6%, year-over-year, to 3.546 million.
In January 2018, cycle movements in the city center of Auckland, New Zealand increased by 1.3%, to 164,140.
In January 2018, there were 163,657 cycle movements in Auckland, New Zealand.
In January 2018, cycle movements in Auckland, New Zealand decreased by 1.5%, year-over-year, to 163,657.
From February 2018 to January 2019, cycle movements in Auckland, New Zealand increased by 4%, year-over-year, to 3.593 million.
In February 2018, cycle movements in Auckland, New Zealand decreased by 5.4%, year-over-year, to 161,167.
In February 2018, cycle movements in the city center of Auckland, New Zealand decreased by 1.9%, year-over-year, to 161,171.
From March 2018 to February 2019, cycle movements in Auckland, New Zealand increased by 6.2%, year-over-year, to 3.65 million.
In March 2018, cycle movements in the city center of Auckland, New Zealand increased by 11.8%, year-over-year, to 193,530.
In March 2018, cycle movements in Auckland, New Zealand increased by 7.3%, to 184,810.
From April 2018 to March 2019, cycle movements in Auckland, New Zealand increased by 6.0%, year-over-year, to 3.68 million.
In April 2018, cycle movements in the city center of Auckland, New Zealand increased by 4.4%, year-over-year, to 157,397.
In April 2018, cycle movements in Auckland, New Zealand decreased by 2.0%, year-over-year, to 151,552.
From May 2018 to April 2019, cycle movements in Auckland, New Zealand increased by 6.5%, year-over-year, to 3.70 million.
In May 2018, cycle movements in the city center of Auckland, New Zealand increased by 4.4%, year-over-year, to 168,152.
In May 2018, cycle movements in Auckland, New Zealand increased by 1.7%, year-over-year, to 156,971.
From June 2018 to May 2019, cycle movements in Auckland, New Zealand increased by 7.1%, year-over-year, to 3.70 million.
From June to July 2018, cycle movements in Auckland, New Zealand increased by 103.8%, or doubled, from 123,116 to 251,000. That’s an increase of 127,844 cycle movements, in one month.
From June to July 2018, the 103.8% month-over-month increase in cycle movements in Auckland, New Zealand was 6,005% greater than their 1.7% long-term average monthly increase from July 2016 to October 2023.
A gigantic, unprecedented societal change for the better has taken place, accompanied by a complete Media blackout on the subject.
In retrospect, it’s quite obvious that the barely-covert international release in December 2019 of a Chinese bat virus weaponized at U.S. taxpayer expense by the godless Communist Red Chinese was a last ditch attempt to derail and defray the great positive societal change then currently underway.
In June 2018, cycle movements in the city center of Auckland, New Zealand decreased by 9.6%, year-over-year, to 123,125.
In June 2018, cycle movements in Auckland, New Zealand decreased by 8.1%, year-over-year, to 123,116.
From July 2018 to June 2019, cycle movements in Auckland, New Zealand increased by 8.9%, year-over-year, to 3.77 million.
In July 2018, cycle movements in Auckland, New Zealand increased by 15%, year-over-year, to 251,000.
From August 2018 to July 2019, cycle movements in Auckland, New Zealand increased by 8.3%, year-over-year, to 3.79 million.
In August 2018, cycle movements in Auckland, New Zealand increased by 2.0%, to 261,000.
From September 2018 to August 2019, cycle movements in Auckland, New Zealand increased by 7.3%, to 3.76 million.
In September 2018, cycle movements in Auckland, New Zealand increased by 15.5%, year-over-year, to 281,000.
From October 2018 to September 2019 cycle movements in Auckland, New Zealand increased by 5.9%, year-over-year, to 3.75 million.
In October 2018, cycle movements in Auckland, New Zealand increased by 17.1%, year-over-year, to 329,000.
From November 2018 to October 2019, cycle movements in Auckland, New Zealand increased by 3.8%, year-over-year, to 3.72 million.
In November 2018, cycle movements in Auckland, New Zealand decreased by 4.0%, year-over-year, to 320,000.
From December 2018 to November 2019, cycle movements in Auckland, New Zealand increased by 5.0%, to 3.75 million.
From December 2018 to January 2019, cycle movements in Auckland, New Zealand increased by 23.6%, month-over-month, from 292,000 to 361,000. That’s an addition of 69,000 cycle movements in one month.
In December 2018, cycle movements in Auckland, New Zealand decreased by 9.0%, year-over-year, to 292,000.
From 2019 to 2022, cycle tourism in Italy increased by 105%, or more than doubled, from 4.4 million to 9 million.
Ecobnb.com’s Phillippo Bruno withheld the percentage, and said only that “The total number of cycle tourists in Italy is constantly growing”. Where “constantly growing” is a ruse, to cover the sudden, exponential increase in cycle tourism in Italy from 2019 to 2022.
Phillippo said cycle tourism had increased suddenly and exponentially in Italy because “Traveling by bike, in fact, reduces carbon emissions, providing an ecological alternative to traditional modes of transportation”.
He didn’t mention that the sudden, exponential increase in cycle tourism in Italy was part of a wider trend taking place regardless of culture or geography. That’s an example of the propaganda technique known as “compartmentalization”.
From 2019 to 2020, miles cycled in England increased by 63%, from 54 to 88.
Globalcyclingnetwork.com’s James Howell-Jones did not offer any suggestion as to what had caused the sudden, exponential increase in cycling in England. That’s an example of the propaganda technique known as “stonewalling”.
James also didn’t mention that the exponential increase in cycling in England was part of a wider trend taking place regardless of culture or geography. That’s an example of the propaganda technique known as “compartmentalization”.
From January to December 2019, cycle movements in Auckland, New Zealand increased by 6.2%, year-over-year, to 3.77 million.
In January 2019, cycle movements in Auckland, New Zealand increased by 15.1%, year-over-year, to 361,000.
From February 2019 to January 2020, cycle movements in Auckland, New Zealand increased by 4.7%, year-over-year, to 3.76 million.
In February 2019, cycle movements in Auckland, New Zealand increased by 20%, year-over-year, to 368,000.
From March 2019 to March 2020, cycle movements in Auckland, New Zealand increased by 2.1%, year-over-year, to 3.8 million.
In March 2019, cycle movements in Auckland, New Zealand increased by 8.3%, year-over-year, to 388,000.
In April 2019, cycle movements in Auckland, New Zealand increased by 6.0%, year-over-year to 311,000.
From May 2019 to May 2020, cycle movements in Auckland, New Zealand decreased by 1.6%, year-over-year, to 3.7 million. At.govt.nz said in comment “Due to the Covid-19 situation, the commuter cyclist movements have decreased significantly after the lockdown, due to increased wet weather conditions, recreational cycle movements did not reach the levels of previous months.”
For those keeping score, a 1.6% year-over-year decrease is not “significant”.
In May 2019, cycle movements in Auckland, New Zealand increased by 10.1%, year-over-year, to 337,000.
In June 2019, cycle movements in Auckland, New Zealand increased by 16.7%, year-over-year, to 272,000.
From July 2019 to June 2020, cycle movements in Auckland, New Zealand increased by 2.9%, year-over-year to 3.7 million. At.govt.nz said in comment “During Alert levels 2 and then 1, commuter cycling increased compared to May 2020, but did not reach the expected levels.”
Wow! We’ve gone from the false claim that cycling decreased by 50% during the lockdown to this uncomfortable pile of claptrap, which has to deal with the resumption of the meteoric increase in cycling in Auckland, New Zealand, despite the government’s most-fervent efforts at social engineering to stop that increase.
In July 2019, cycle movements in Auckland, New Zealand increased by 5.9%, to 266,000.
From August 2019 to July 2020, cycle movements in Auckland, New Zealand decreased by 3.8%, year-over-year, to 3.65 million.
In August 2019, cycle movements in Auckland, New Zealand decreased by 11.2%, year-over-year, to 232,000. Note: Auckland’s 190 mm of rainfall in August 2019 was 95.9% greater, or basically double its long-term average 97 mm. At.govt.nz withheld the percentage, and described it only-generally as “a very wet August”.
From September 2019 to August 2020, cycle movements in Auckland, New Zealand decreased by 1.4%, to 3.7 million.
In September 2019, cycle movements in Auckland, New Zealand decreased by 3.8%, year-over-year, to 270,000. Note: Auckland’s 125 mmm of rainfall in September 2019 was 95.3% greater, or basically double its long-term average of 64mm. At. govt.nz withheld the percentage and described it only-generally as “another wet month”.
From October 2019 to September 2020, cycle movements in Auckland, New Zealand decreased by 0.8%, to 3.7 million.
From October to November 2019, cycle movements in Auckland, New Zealand increased by 14.8%, month-over-month, from 305,000 to 350,000.
In October 2019, cycle movements in Auckland, New Zealand decreased by 7.3%, year-over-year, to 305,000.
From November 2019 to October 2020, cycle movements in Auckland, New Zealand increased by 0.5%, year-over-year, to 3.7 million.
In November 2019, cycle movements in Auckland, New Zealand increased by 9.3%, year-over-year to 350,000.
From December 2019 to November 2020, cycle movements in Auckland, New Zealand decreased by 1.8%, to 3.7 million.
From December 2019 to January 2020, cycle movements in Auckland, New Zealand increased by 17.7%, month-over-month, from 305,000 to 359,000. That’s an additional 55,000 cycle movements, in one month.
In December 2019, cycle movements in Auckland, New Zealand increased by 4.5%, year-over-year, to 305,000.
From 2020 to 2023, cyclingauthority.com’s John Swanstrom said that the average annual increase in the global bicycle market would be 1.08%.
From January 2020 to December 2020, cycle movements in Auckland, New Zealand decreased by 2.6%, year-over-year, to 3.7 million.
3.7 million cycle movements were recorded for the year of January 2020 to December 2020, a decrease of 2.6% on the previous 12 months.
From January to February 2020, cycle movements in Auckland, New Zealand increased by 13.6%, month-over-month, from 359,000 to 408,000. That’s an additional 49,000 cycle movements, in one month.
In January 2020, cycle movements in Auckland, New Zealand decreased by 0.6%, year-over-year, to 359,000.
From February 2020 to January 2021, cycle movements in Auckland, New Zealand decreased by 3.9%, to 3.6 million.
From February to April 2020, cycle movements in Auckland, New Zealand decreased by 26.9%, from 408,000 to 298,000.
From February to March 2020, cycle movements in Auckland, New Zealand decreased by 12.99%, from 408,000 to 355,000.
In February 2020, cycle movements in Auckland, New Zealand increased by 11%, year-over-year, to 408,000.
From March 2020 to March 2023, spending on bicycles and accessories in the United States increased by 620%. The uncredited Intelligence operative from bts.gov said that it was “notable”, and offered no suggestion as to why the hyper-exponential increase might have taken place. The latter is an example of the propaganda technique known as “stonewalling”.
From March 2020 to February 2023, the total value of non-motorized bicycles imported into the United States increased by 18,000% from $500,000 to $1,000,000,000.
From March 2023 to February 2023, the average annual increase in the total value of non-motorized bicycles imported into the United States was 6,000%. While we learned previously that cyclingauthority.com’s John Swanstrom said that the average annual increase in the global bicycle market from 2020 to 2023 would be 1.08%.
From March 2020 to March 2023, the actual 6,000% average annual increase in the total value of non-motorized bicycles imported into the United States was 555,455% greater than the 1.08% average annual increase in the global bicycle market from 2020 to 2023 projected by cyclingauthority.com’s John Swanstrom. Put another way, John falsely downgraded the actual 6,000% average annual increase by 555,455% to a fraudulent 1.08% projected increase.
Cyclingauthority.com](http://cyclingauthority.com/)’s John Swanstrom is a pathologically-lying generational Satanist Freemason. I have exposed his duplicity by using what was known in the old days as “fact checking".
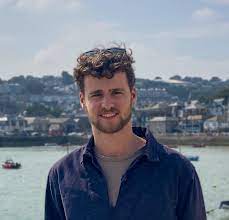
Here’s John Swanstrom’s picture, in a Satanic purple cycling jersey:

(John Swanstrom)
I have included his picture so that you could get a better idea of what a generational Satanist Freemason in a position of marginal influence looks like.
They are all related to one another through the maternal bloodline. They comprise roughly twenty percent of the populace, and are hiding in plain sight in every city, town and village on Earth.
It’s how the few have controlled the many all the way back to Babylon, and before.
But they say that the hardest part of solving a problem is recognizing that you have one.
Don Croft used to say “Parasites fear exposure above all else”.
From March 2020 to February 2021, cycle movements in Auckland, New Zealand decreased by 7.5%, year-over-year, to 3.5 million.
In March 2020, cycle movements in Auckland, New Zealand, decreased by 8%, year-over-year, to 355,000. At.govt.nz said “Due to the Covid-19 situation, the commuter cyclist movements have decreased significantly after the lockdown, but recreational cyclist movements have increased in residential areas. Overall cycling demand reduced by approximately 50% after the lockdown.” When, in fact, cycle movements in Auckland, New Zealand decreased by 13% from February to March 2020, month-over-month.
The government of New Zealand has falsely exaggerated the decrease by 284%, or by almost four times, from an actual 13% to a fraudulent 50%.
And did you notice the sleight-of-hand where “cycling movements” was deftly switched to “cycling demand”?
To make matters worse for the serially-lying sociopaths, from January 2020 to December 2020, during the “great plague of Covid”, cycle movements in Auckland, New Zealand decreased by just 2.6%, year-over-year, to 3.7 million. Compare that fact with this propaganda: “Overall cycling demand reduced by approximately 50% after the lockdown.”
I have exposed the duplicity of the bike Feds in New Zealand by using what was known in the old days as “fact checking”.
From April 2020 to March 2021, cycle movements in Auckland, New Zealand decreased by 7.7%, year-over-year, to 3.5 million.
In April 2020, cycle movements in Auckland, New Zealand decreased by 4%, year-over-year, to 298,000. At.govt.nz said “Due to the Covid-19 situation, the commuter cyclist movements have decreased significantly after the lockdown, but recreational cyclist movements have increased in residential areas.”
Wait, what? People are afraid to commute to work in the city of Auckland, but aren’t afraid to ride recreationally in the city of Auckland? That’s a brazenly false claim.
The truth is that everybody claimed to be afraid, and used it as an excuse to “work remotely” (which means doing as little work as possible without getting fired) and used the rest of the time to play video games and binge-watch Netflix. Then they went for recreational bike rides.
From May 2020 to April 2021, cycle movements in Auckland, New Zealand decreased by 7.7%, year-over-year, to 3.5 million.
In May 2020, cycle movements in Auckland, New Zealand decreased by 24%, year-over-year, to 258,000. At.govt.nz said “Due to the Covid-19 situation, the commuter cyclist movements have decreased significantly after the lockdown, due to increased wet weather conditions, recreational cycle movements did not reach the levels of previous months.”
Here, it is brazenly and falsely alleged that only commuters were afflicted with fear of barely-covert international release of the Chinese bat virus weaponized at U.S. taxpayer expense, while recreational riders, unafraid of the deadly, slate-wiper virus nevertheless pussed out because it was raining.
With the truth being that record rainfall in Auckland was the primary driver of the 24% year-over-year decrease in cycling movements there in May 2020.
Did you notice how the Feds in New Zealand didn’t provide any metrics about the record rainfall, and, further, did not mention anything about what might be causing it? Those are examples of the propaganda technique known as “stonewalling”.
In June 2020, cycle movements in Auckland, New Zealand decreased by 4%, year-over-year, to 262,000. At.govt.nz said in comment “During Alert levels 2 and then 1, commuter cycling increased compared to May 2020, but did not reach the expected levels.”
Wait, what? Previously, the bike Feds in New Zealand said, only-generally, that commuter cyclist movements had “decreased significantly after lockdown, while recreational riders somehow increased during the same time period. Yet, here, we have a sudden, albeit non-quantified increase
From July 2020 to June 2021, cycle movements in Auckland, New Zealand decreased by 5%, year-over-year, to 3.5 million.
In July 2020, cycle movements in Auckland, New Zealand decreased by 7.2%, year-over-year, to 247,000.
In August 2020, cycle movements in Auckland, New Zealand increased by 23.6%, year-over-year, to 287,000.
From September 2020 to August 2021, cycle movements in Auckland, New Zealand decreased by 7.5%, year-over-year, to 3.4 million.
From September to October 2020, cycle movements in Auckland, New Zealand increased by 17%, month-over-month, from 282,000 to 330,000. That’s an additional 48,000 cycle movements, in one month.
Hey, wait a minute. What gives? I thought that the Chinese bat virus weaponized at U.S. taxpayer expense by the godless Communist Red Chinese was a slate-wiper, putting everybody on ventilators, and such and such?
In September 2020, cycle movements in Auckland, New Zealand increased by 4.5%, year-over-year, to 282,000.
From October 2020 to September 2021, cycle movements in Auckland, New Zealand decreased by 8.7%, year-over-year, to 3.4 million.
In October 2020, cycle movements in Auckland, New Zealand increased by 8.3%, year-over-year, to 330,000.
From November 2020 to October 2021, cycle movements in Auckland, New Zealand decreased by 11.2%, year-over-year, to 3.3 million.
In November 2020, cycle movements in Auckland, New Zealand, cycle movements in Auckland, New Zealand decreased by 16.8%, year-over-year, to 291,482.
From December 2020 to November 2021, cycle movements in Auckland, New Zealand decreased by 10.4%, year-over-year, to 3.3 million.
In December 2020, cycle movements in Auckland, New Zealand decreased by 5.4%, year-over-year, to 288,466.
From 2021 to 2022, the number of German residents who did a cycling trip increased by 39%, from 3.9 million to 5.4 million.
The uncredited Intelligence operative from eurovelo.com also didn’t mention that the exponential increase in cycling tourism in Germany was part of a wider trend taking place regardless of culture or geography. That’s an example of the propaganda technique known as “compartmentalization”.
From January 2021 to December 2022 versus January 2022 to December 2022, cycle movements in Auckland, New Zealand decreased by 9.7%, from 3.2 million to 2.89 million.
From January to December 2021, cycle movements in Auckland, New Zealand decreased by 11.4%, year-over-year, to 3.2 million.
From January to December 2020 to January to December 2021, cycle movements in Auckland, New Zealand decreased by 13.5%, from 3.7 million to 3.2 million.
In January 2021, cycle movements in Auckland, New Zealand decreased by 13.8%, year-over-year, to 309,387.
From February 2021 to January 2022, cycle movements in Auckland, New Zealand decreased by 11.5%, year-over-year, to 3.2 million.
In February 2021, cycle movements in Auckland, New Zealand decreased by 24.2%, to 309,716.
From March 2021 to February 2022, cycle movements in Auckland, New Zealand decreased by 10.9%, year-over-year, to 3.1 million.
3.1 million cycle movements were recorded for the year of March 2021 to February 2022, a decrease of 10.9% on the previous 12 months.
In March 2021, cycle movements in Auckland, New Zealand decreased by 10.5%, year-over-year, to 317,975.
From April 2021 to March 2022, cycle movements in Auckland, New Zealand decreased by 11.2%, year-over-year, to 3.1 million.
In April 2021, cycle movements in Auckland, New Zealand decreased by 3.6%, year-over-year, to 288,097.
From May 2021 to April 2022, cycle movements in Auckland, New Zealand decreased by 12.1%, year-over-year, to 3.1 million.
From June 2021 to May 2022, cycle movements in Auckland, New Zealand decreased by 13.6%, year-over-year, to 3.0 million.
In June 2021, cycle movements in Auckland, New Zealand decreased by 6.0%, year-over-year, to 245,618.
From July 2021 to June 2022, cycle movements in Auckland, New Zealand decreased by 14.4%, year-over-year, to 2.98 million.
In July 2021, cycle movements in Auckland, New Zealand increased by 1%, year-over-year, to 248,991.
From August 2021 to July 2022, cycle movements in Auckland, New Zealand decreased by 16.1%, year-over-year, to 2.92 million.
In August 2021, cycle movements in Auckland, New Zealand decreased by 21%, year-over-year, to 226,362.
From September 2021 to August 2022, cycle movements in Auckland, New Zealand decreased by 14.5%, to 2.93 million.
In September 2021, cycle movements in Auckland, New Zealand decreased by 11.7%, year-over-year, to 249,038.
From October 2021 to September 2022, cycle movements in Auckland, New Zealand decreased by 14.1%, year-over-year, to 2.92 million.
In October 2021, cycle movements in Auckland, New Zealand decreased by 20.9%, year-over-year, to 261,096.
From November 2021 to October 2022, cycle movements in Auckland, New Zealand decreased by 12.5%, year-over-year, to 2.91 million.
In November 2021, cycle movements in Auckland, New Zealand decreased by 7.9%, year-over-year, to 268,546.
From December 2021 to November 2022, cycle movements in Auckland, New Zealand decreased by 12.3%, year-over-year, to 2.90 million.
In December 2021, cycle movements in Auckland, New Zealand decreased by 18.8%, to 234,184.
From January 2022 to March 2023, cycle movements in Auckland, New Zealand increased by 16.3%, from 234,184 to 272,302.
In January 2022, cycle movements in Auckland, New Zealand decreased by 18.8%, year-over-year, to 234,184.
From February 2022 to March 2023, cycle movements in Auckland, New Zealand decreased by 3.0%, year-over-year, to 3.0 million.
In February 2022, cycle movements in Auckland, New Zealand decreased by 21.1%, year-over-year, to 244,422.
From March 2022 to February 2023, cycle movements in Auckland, New Zealand decreased by 7.6%, year-over-year, to 2.90 million.
From March 2022 to April 2023, cycle movements in Auckland, New Zealand decreased by 1.1%, year-over-year, to 3.0 million.
In March 2022, cycle movements in Auckland, New Zealand decreased by 14.4%, year-over-year, to 272,302.
From April 2022 to May 2023, cycle movements in Auckland, New Zealand decreased by 0.4%, year-over-year, to 3.0 million.
In April 2022, cycle movements in Auckland, New Zealand decreased by 13.8%, year-over-year, to 248,393.
In May 2022, cycle movements in Auckland, New Zealand decreased by 9.2%, year-over-year, to 261,756.
In June 2022, cycle movements in Auckland, New Zealand decreased by 17.4%, year-over-year, to 202,830.
From July 2022 to June 2023, cycle movements in Auckland, New Zealand increased by 2.1%, year-over-year, to 3.043 million.
In July 2022, cycle movements in Auckland, New Zealand decreased by 22.5%, year-over-year, to 192,950.
From August 2022 to September 2023, cycle movements in Auckland, New Zealand increased by 7.2%, year-over-year, to 3.13 million.
From August 2022 to July 2023, cycle movements in Auckland, New Zealand increased by 5.1%, to 3.07 million.
In August 2022, at.govt.nz said “231,082 cycle movements were recorded in May 2021, 2.1% increase compared to August 2021.” We must presume that “in May 2021” is an error. We know that, in August 2021, there were 226,362 cycle movements in Auckland, New Zealand.
In August 2022, cycle movements in Auckland, New Zealand increased by 2%, year-over-year, from 226,362 to 231,082.
From September 2022 to October 2023, cycle movements in Auckland, New Zealand increased by 8.1%, year-over-year, to 3.14 million.
From September 2022 to August 2023, cycle movements in Auckland, New Zealand increased by 5.1%, year-over-year, to 3.11 million.
In September 2022, at.govt.nz said “234,300 cycle movements were recorded in September 2021, 5.9% decrease compared to September 2021. We must presume that “in September 2021” is an error. We know that, in September 2021, there were 249,038 cycle movements in Auckland, New Zealand.
In September 2022, cycle movements in Auckland, New Zealand decreased by 6%, year-over-year, from 249,038 to 234,000.
In October 2022, at.govt.nz said “253,992 cycle movements were recorded in October 2021, 2.7% decrease compared to October 2021.” Where the first “October 2021” is an error. We know that there were 261,096 cycle movements in Auckland, New Zealand in October 2021.
In October 2022, cycle movements in Auckland, New Zealand decreased by 2.7%, from 261,096 to 253,992.
In November 2022, cycle movements in Auckland, New Zealand decreased by 4.6%, to 256,138.
In December 2022, cycle movements in Auckland, New Zealand decreased by 3.4%, to 226,238.
In December 2022, at.govt.nz said “2.89 million cycle movements were recorded for the year of January 2021 to December 2022 a decrease of 11.1% on the previous 12 months.”
Where “January 2021” is an error. We know that 3.2 million cycle movements were recorded for the year of January 2021 to December 2021.
In January 2023, cycle movements in Auckland, New Zealand decreased by 9.6%, year-over-year, to 238,651.
In February 2023, cycle movements in Auckland, New Zealand increased by 14.7%, year-over-year, to 280,394.
In March 2023, cycle movements in Auckland, New Zealand increased by 36.1%, year-over-year, from 272,302 to 370,592. That’s an additional 98,290 cycle movements.
In March 2023, the 36.1% year-over-year increase in cycle movements in Auckland, New Zealand was 145.5% greater, or well more than double their 14.7% year-over-year increase in February 2023.
The great positive societal change is increasing hyper-exponentially, going forward in time.
That’s because the health of the ether is increasing, and moral and mental health vary directly with that of the subject’s etheric environment.
In April 2023, cycle movements in Auckland, New Zealand increased by 8.2%, year-over-year, to 268,768.
In May 2023, cycle movements in Auckland, New Zealand decreased by 2.4%, year-over-year, to 255,498.
In June 2023, cycle movements in Auckland, New Zealand increased by 15.8%, year-over-year, to 238,841.
In June 2023, the 15.8% year-over-year increase in cycle movements in Auckland, New Zealand was 758.3% greater than their 2.4% year-over-year decrease in May 2023.
In June 2023, John Swanstrom of cyclistsauthority.com said “the global bicycle market size was valued at USD 47.4 billion in 2020 and is projected to grow at a compound annual growth rate (CAGR) of 7.4% from 2021 to 2028.” That’s an average annual increase of 1.08% over each of those seven years.
When, in fact, the total value of non-motorized bicycles imported into the United States increased by 18,000% from March 2020 to February 2023, from $500,000 to $1,000,000,000, and spending on bicycles and accessories in the United States increased by 620% from March 2020 to March 2023.
I have exposed the duplicity of John Swanstrom and his website, cyclistsauthority.com, by using what was known in the old days as “fact checking”.
In July 2023, cycle movements in Auckland, New Zealand increased by 16.7%, year-over-year, to 225,140.
In August 2023, cycle movements in Auckland, New Zealand increased by 14.8%, year-over-year, to 265,361.
In September 2023, cycle movements in Auckland, New Zealand increased by 6.8%, year-over-year, to 250,236.
In October 2023, cycle movements in Auckland, New Zealand increased by 7.2%, year-over-year, to 272,198.
THE ARTICLES
In 2014, liveablestreets.info said “Bike use is rising among the young, but it’s skyrocketing among the old”.
Where they used “rising” because it’s softer than “increasing”, and also as a thinly-veiled reference to the Atonist Black-Sun cult that’s ruled things in all the nations, well, all the way back to Babylon, and before. Their Lord Lucifer is “the son of the dawning”.
There’s a strict rule in journalism, where you put larger percentages first, and then the rest in descending order. Here, the author has brazenly inverted it, leading with the smaller “rising”, to downplay the magnitude of the phenomenon as best they might.
In July 2016, nacto.org said “High-Quality Bike Facilities Increase Ridership and Make Biking Safer”.
It’s another Satanic inversion - the bike facilities were in actuality put in to accommodate increasing ridership, and as a plausible-deniability excuse to cover up the actual driver, that being the broad improvement of moral character that is taking place society-wide, regardless of national boundary.
What’s humorous about it is that the CitiBike riders of every city on Earth are by far the most unsafe component of the cycling population. Most people who use them don’t wear a helmet or gloves, and most are novice cyclists.
Please don’t misunderstand me: as a seasoned cyclist I welcome them. I’m simply pointing out the false propaganda surrounding their arrival.
The folks in charge are not your friends, and are lying to you about basically everything, including the safety of CitiBikes.
In November 2016, Halfords said that bike prices could “rise” in the U.K., “because of Brexit vote”.
Where they used “rise” because it’s softer than “increase”, and also as a thinly-veiled reference to the Atonist Black-Sun cult that’s ruled things in all the nations, well, all the way back to Babylon, and before. Their Lord Lucifer is “the son of the dawning”.
Cycling increased 6% internationally from 2017 to 2018.
In September 2017, Middle East Eye said “Egyptians resort to cycling to bypass rising petrol prices.”
“Middle East Eye” is an insider-wink reference to the all-seeing Eye of Horus.
“Rising petrol prices” is a bullshit plausible-deniability excuse, put forward as a smoke screen to cover up the broad moral improvement being seen among the populace in Egypt, and everywhere else.
Only the article doesn’t mention that cycling is increasing in popularity in other nations. That’s an example of the propaganda technique known as “compartmentalization”.
In January 2017, cycleto.ca said “Major increase in Torontonians biking to work: up to 34% in some neighbourhoods”.
The article continues: “Drilling down to the neighbourhood level, the following have cycling mode shares far exceeding the 20% threshold (shown as dark green in the maps). These are incredibly high numbers - though they should be taken in the context of very small sample sizes given the unit of measurement is Dissemination area (often with a population <1,000 except in the densest parts of the city).
Not only are we seeing increases in these pockets, but rates of active modes (which includes walking and cycling) across the city appear to be growing - though unfortunately, there is no corresponding map from the 2006 census.
(Can you see how the author deviously worded it to imply that the “major” increase was an up-to-34% increase? No. The statistics show that some neighborhoods have 34% of their inhabitants commuting on their bikes. The increase in one of the neighborhoods was 278%, in ten years.”
The author has devious omitted the most-impactful example, a near quadrupling of cycling in one (unnamed) neighborhood.
You may have also notice how the data’s deviously hidden in maps and charts, vs. laid out for you.
Those are both examples of the propaganda technique known as “compartmentalization”.
In 2016, bicycle commuting in Toronto, Canada increased by 34%.
In February 2018, cyclingweekly.com said “Cycling now the most popular form of rush hour transport on London streets, report shows”. The author tacked “report shows” on the end to give the subconscious of the reader the green light to say “oh, but was just one report!” The propagandist knows that many or most readers will grasp virtually any straw, no matter how thin, to remain off the hook of personal responsibility.
The subhead reads “City of London report shows four-fold increase in cycling in City in last 19 years”. Can you see how they threw the “report shows” out in there again? The claim of 19 years uses an important Illuminist number that you may remember from the 19 swarthy terrorists purportedly involved in the dropping of numerous buildings in the World Trade Center complex into their own footprints at freefall speeds, including one doing so without any interactions with an airplane. There is, indeed, a sucker born every minute.
“In last 19 years” makes like it’s been a long, slow climb over almost two decades. They’re doing that to take your eye off the sudden societal change that’s taken place, regardless of national boundary.
They author hedged by using “four fold” in the headline, to avoid using the much-more-impacful “400% increase”, or “quadrupling in cycling”. “Slowed since 2012” is a bald-faced lie. It’s a Satanic inversion, to get your eyes off the great positive changes that began in 2012, including exponential increases in cycling that are taking place regardless of culture or geography.
From 1999 to 2018, cycling in London, England increased by 300%, or quadrupled.
The article continues: “Anyone in London will be able to tell you about the surge in cycling numbers in the capital in recent years, but the latest survey of transport modes in the capital has shown in stark detail just how popular cycling has become. The City of London Corporation has been running its Traffic in the City study for the last 19 years, with its survey of traffic at 15 locations in the City of London showing loud and clear the huge uptake in cycling over those years. Since 1999 all modes of above-ground transport have reduced by 25-50 per cent, with the exception of cycling, which is now four times as popular as it was 19 years ago.”
The article goes on to say “The latest survey of transport modes in the capital has shown in stark detail just how popular cycling has become.”
“Doublespeak is language that deliberately obscures, disguises, distorts, or reverses the meaning of words.”
- Wikipedia
-
Stark – adjective - rigid in or as if in death
Barren, desolate – having few or no ornaments
Harsh, blunt – “the stark realities of death”
The article talks on and on about London, but takes great care not to mention that the cycling increase there maps against increases being seen in every city, town and village on Earth, regardless of culture or geography. That’s an example of the propaganda technique known as “compartmentalization”.
There’s also no mention as to what’s driving the exponential increase in cycling in London. That’s an example of the propaganda technique known as “stonewalling”.
In March 2018, directly in the face of a cycling boom that was then increasing in speed and magnitude, wired.co.uk bitterly muttered “London’s cycling boom is slowing. And it’s still mostly white men”.
In May 2018, directly in the face of exponentially increasing numbers of cyclists in the UK, Cycling UK told of “Ambitious plans to increase the number of cyclists”.
The folks in charge are playing like they’re going to make it happen, after it has already happened, only you are too dim to have noticed that it has already happened. While the truth is that there are great positive changes taking place at the societal level that have nothing to do with the ruling Illuminist Establishment, and everything to do with the fact that moral and mental health vary directly with that of the subject’s etheric environment.
In July 2018, dublincycling.com said “New Study Reveals Huge Numbers Commuting by Bike on Dublin’s Quays”.
Did you notice how the headline starts off with “New study reveals”? That’s to give the subconscious of the reader the green light to say “oh, but that was just one study!” The propagandist knows that many or most readers will grasp virtually any straw, no matter how thin, to remain off the hook of personal responsibility.
The author used “huge numbers” as a hedging generality against providing a far more impactful, specific statistic. That’s an example of the propaganda technique known as “compartmentalization”. The propagandist knows that, since sixty to seventy percent of readers only read the headlines, a majority of readers won’t get any accurate idea of the scope of the phenomenon.
The article continues: “Bicycles account for half of all vehicles on the North Quays during the morning rush hour.
A new traffic survey carried out by the Dublin Cycling Campaign has revealed how popular cycling has become for people commuting into the city centre, despite the lack of dedicated cycling infrastructure. This new traffic survey reinforces Dublin Cycling Campaign’s demand for urgent action to be taken to progress the construction of the Liffey Cycle Route. This segregated cycle route, which was first proposed in 2011, has withered in the hands of Dublin City Council and the National Transport Authority for long enough and we are now calling for real leadership to realise the scheme. It is totally unacceptable that such a critical project as this can spend seven years in gestation without even a final design to show for it.”
Despite the massive popularity of cycling, the folks in charge in Dublin demonstrate their anti-human agenda with nearly a decade of stonewalling on the project.
On March 16, 2023, pro.eurovelo.com said “ADFC Bicycle Travel Analysis 2023: cycling tourism in Germany keeps growing after the pandemic”.
Where the uncredited author said “Keeps growing after the pandemic” in place of the specific statistic which, in journalistic parlance, they “buried” in the body text below.
That’s because, as a propagandist, the uncredited author knows that sixty to seventy percent of readers only read the headlines, and his technique goes a long way toward “compartmentalizing” awareness of the specific magnitude of the increase in cycle tourism which they are attempting to obfuscate.
For those unaware, anytime an author is uncredited, it is proof that said author is an Intelligence operative.
The author averred “after the pandemic” to break up the trend, and imply that it had not been increasing prior to the barely covert international release of a Chinese bat virus weaponized at U.S. taxpayer expense by the godless Communist Red Chinese.
The article goes on to say “One of the key findings is that 4,6 million German residents have done a cycling trip in 2022, a significant growth compared to the numbers of 2021 (3,9 million) but still not as high as the pre-pandemic levels (5,4 million in 2019).”
Where, with “significant growth”, the propagandist has once again generalized. So, I had to do the math.
From 2021 to 2022, the number of German residents who did a cycling trip increased by 39%, from 3.9 million to 5.4 million.
The statement “but still not as high as the pre-pandemic levels” is a bald-faced lie, as you’ll learn in a moment.
Using a time-honored propaganda technique, the uncredited Intelligence operative from eurovelo.com buried the rest of the data in a separate table below.
If just 30% of readers read the articles, what percentage do you think do the math on the data in the tables?
It’s another example of the propaganda technique known as “compartmentalization”.
So, I had to do the math.
From 2014 to 2022, the number of German residents who did a cycling trip increased by 35%, from 4.0 million to 5.4 million.
As you can see, “but still not as high as the pre-pandemic levels” is a bald-faced lie. I have exposed the duplicity of eurovelo.com by using what was known in the old days as “fact checking”.
From 2014 to 2022, the average annual increase in the number of Germans who did a cycling trip was 4.4%.
From 2021 to 2022, the 39% increase in Germans who did a cycling trip was 786% greater, or almost nine times greater than the 4.4% average annual increase in same from 2014 to 2022.
The great positive societal change is increasing hyper-exponentially, going forward in time.
That’s because the health of the ether is increasing, and moral and mental health vary directly with that of the subject’s etheric environment.
The uncredited Intelligence operative from eurovelo.com did not offer any suggestion as to what had caused the sudden, exponential increase in cycle tourism in Germany. That’s an example of the propaganda technique known as “stonewalling”.
They also didn’t mention that it was part of a wider trend taking place regardless of culture or geography. That’s an example of the propaganda technique known as “compartmentalization”.
The article goes on to say “E-bike usage is still relevant, but slightly shrinking”, and that “The ADFC Analysis 2023 shows that a smaller percentage of users – 38%, compared to 42% in 2021 – used an e-bike in the previous year.”
Where, with “slightly shrinking” and “a smaller percentage of users”, the uncredited propagandist has called out the single decrease in the data set to create a false picture of lessening e-bike usage.
Using a time-honored propaganda technique, the uncredited Intelligence operative “buried” the full data set in a table below, to give the misleading impression that the e-bike market was contracting.
If just 30% of readers read the articles, what percentage do you think do the math on the data in the tables?
It’s another example of the propaganda technique known as “compartmentalization”.
So, I had to do the math.
From 2017 to 2022, e-bike usage in Germany as a percentage of total bicycling in Germany increased by 111%, or more than doubled, from 18% to 38%.
The uncredited Intelligence operative from eurovelo.com withheld the percentage, saying only that e-bikes in Germany were “still relevant, but slightly shrinking”.
On March 19, 2023, bts.gov said “Notable for Bike To Work Week: National Spending on Bicycles and Accessories Grew 620% from March 2020 to March 2023; Docked Bikeshare Grew 42% percent”.
From March 2020 to March 2023, spending on bicycles and accessories in the United States increased by 620%. The uncredited Intelligence operative from bts.gov said that it was “notable”, and offered no suggestion as to why the hyper-exponential increase might have taken place.
The latter is an example of the propaganda technique known as “stonewalling”.
The article goes on to say “Increased demand for bicycles also has contributed to an increase in imports of bicycles. The total value of non-motorized bicycles imported increased just over 18,000% from 0.5 million in March 2020 to 1.0 billion in February 2023 (adjusted for inflation).”
From March 2020 to February 2023, the total value of non-motorized bicycles imported into the United States increased by 18,000%, from $500,000 to $1,000,000,000.
On June 1, 2023, cyclistsauthority.com said “Cycling Statistics 2023”. Where, despite being a cyclist for thirty years, and also despite running a website dedicated to cycling, author John Swanstrom somehow managed to avoid mentioning that cycling was increasing hyper-exponentially in 2023.
That’s an example of the propaganda technique known as “compartmentalization”.
That’s because, as a propagandist, John knows that sixty to seventy percent of readers only read the headlines, and their technique goes a long way toward “compartmentalizing” awareness of the specific magnitude of the hyper-exponential increase in cycling which he is attempting to obfuscate.
Actually, I’m being too generous. John didn’t provide any information on the hyper-exponential increase in cycling in 2023. Here’s the best he could give us: “the global bicycle market size was valued at USD 47.4 billion in 2020 and is projected to grow at a compound annual growth rate (CAGR) of 7.4% from 2021 to 2028.”
When, in fact, the total value of non-motorized bicycles imported into the United States increased by 18,000%, from $500,000 to $1,000,000,000.
I have exposed the duplicity of John Swanstrom and his website, cyclistsauthority.com, by using what was known in the old days as “fact checking”.
Here’s John Swanstrom’s picture, in a Satanic purple cycling jersey:
(John Swanstrom)
I have included his picture so that you could get a better idea of what a generational Satanist Freemason in a position of marginal influence looks like.
They are all related to one another through the maternal bloodline. They comprise roughly twenty percent of the populace, and are hiding in plain sight in every city, town and village on Earth.
It’s how the few have controlled the many all the way back to Babylon, and before.
But they say that the hardest part of solving a problem is recognizing that you have one.
Don Croft used to say “Parasites fear exposure above all else”.
A current article from Auckland, New Zealand on at.govt.nz is headlined “Monthly cycle monitoring”.
Where, under the false guise of familiarity, the uncredited Intelligence operative from the New Zealand government omitted any mention of New Zealand, Aukland, or the time periods under discussion, to make the subject virtually unsearchable.
Those are all examples of the propaganda technique known as “compartmentalization”.
On September 1, 2023, globalcyclingnetwork.com said “Cycling mileage on the up in England, according to latest figures”.
Where author James Howell-Jones said “cycling milage on the up” in place of the specific statistic which, in journalistic parlance, he “buried” in the body text below.
That’s because, as a propagandist, James knows that sixty to seventy percent of readers only read the headlines, and his technique goes a long way toward “compartmentalizing” awareness of the specific magnitude of the increase in cycle tourism which he is attempting to obfuscate.
James deviously substituted “cycling mileage” for “cycle tourism” to make the subject less searchable. That’s an example of the propaganda technique known as “compartmentalization”.
He tacked the snide “according to the latest figures” on the end to give the subconscious of the Coincidence theorist reader the green light to say “oh, but they can make those cycling figures say anything!”
As a propagandist, James Howell-Jones knows that many or most readers will grasp virtually any straw, no matter how thin, to remain off the hook of personal responsibility.
Using a time-honored propaganda technique, James “buried” the data in a table below. If just 30% of readers actually read the articles, what percentage do you think do the math on the data in the tables?
It’s an example of the propaganda technique known as “compartmentalization”.
So, I had to do the math.
From 2004 to 2016, sub-five mile journeys taken by cycling or walking in England decreased by 2.6%, from 38% to 37%. Then, from 2016 to 2021, they increased by 27%, from 37% to 47%.
Globalcyclingnetwork.com’s James Howell-Jones said “since the government began recording these figures in 2002, the number of bike trips has been steady”, to obscure the sudden, exponential increase in cycling which began in 2016.
From 2002 to 2022, miles cycled annually in England increased by 45%, from 38 to 55. Globalcyclingnetwork’s James Howell-Jones withheld the percentage, and described it as “rises steadily”.
He did that because “rises steadily” general, and also a thinly-veiled reference to the Atonist Black sun cult which has ruled things in all the nations, under various names and guises, all the way back to Babylon, and before.
(King Akhenaton (left) with his wife, Queen Nefertiti, and three of their daughters under the rays of the sun god Aton, altar relief, mid-14th century BCE; in the State Museums at Berlin)
James didn’t mention that the exponential increase in cycling in England was part of a wider trend taking place regardless of culture or geography. That’s an example of the propaganda technique known as “compartmentalization”.
Here’s James Howell-Jones’ picture, in a Satanic purple shirt, and where the image is constructed to focus attention on his left eye:
(globalcyclingnetwork.com’s James Howell-Jones)
The image features his left eye because, to generational Satanist Freemasons like James, the left eye is the “eye of Will” or the “eye of Horus”.
But don’t take my word for it:
‘The right eye is the Eye of Ra and the left is the Eye of Horus’.”
From “Freemasonry - Religion And Belief - The 3rd Temple”
Facebook: “Welcome to the Left-Hand-Path-Network, where Satanism is not about worship, but it’s study.”
I have included James’ picture so that you could get a better idea of what a generational Satanist Freemason in a position of marginal influence looks like.
He figured that the rubes would never notice the coded visual imagery.
They are all related to one another through the maternal bloodline. They comprise between twenty and thirty percent of the populace, and are hiding in plain sight in every city, town and village on Earth.
It’s how the few have controlled the many all the way back to Babylon, and before.
But they say that the hardest part of solving a problem is recognizing that you have one.
Don Croft used to say “Parasites fear exposure above all else”.
On November 4, 2023, ecobnb.com said “Cycle Tourism In Italy: Not Just A Niche Anymore! Here Are The Numbers Of A Fast-growing Trend”.
Where author Phillippo Brunato said “the numbers of a fast-growing trend” in place of the specific statistic which, in journalistic parlance, he “buried” in the body text below.
That’s because, as a propagandist, Phillippo knows that sixty to seventy percent of readers only read the headlines, and his technique goes a long way toward “compartmentalizing” awareness of the specific magnitude of the increase in cycle tourism which he is attempting to obfuscate.
The article goes on to say “The total number of cycle tourists in Italy is constantly growing: there were 9 million in 2022 (in 2019 there were 4.4 million), a number that created an economic impact of over 1 billion euros.”
Can you see how Phillippo used the general “constantly growing” in place of a specific statistic? That’s another example of the propaganda technique known as “compartmentalization”.
As a bonus, Phillippo cunningly used “constantly growing” to obscure the sudden, exponential increase in cycle tourism in 2022.
So, I had to do the math.
From 2019 to 2022, cycle tourism in Italy increased by 105%, or more than doubled, from 4.4 million to 9 million.
Ecobnb.com’s Phillippo Bruno withheld the percentage, and said only that “The total number of cycle tourists in Italy is constantly growing”.
Phillippo said cycle tourism had increased suddenly and exponentially in Italy because “Traveling by bike, in fact, reduces carbon emissions, providing an ecological alternative to traditional modes of transportation”.
He also didn’t mention that it was part of a wider trend taking place regardless of culture or geography. That’s an example of the propaganda technique known as “compartmentalization”.
None of the stories I’m documenting here mention that the local incidence they’re speaking of is part of a larger, wider trend. They’re all using a propaganda technique known as “compartmentalization”.
The article from Toronto also notes an increase in walking, there. I’ve seen a huge increase in people on the street in Pittsburgh, and in Brooklyn.
It really shouldn’t surprise us that society is permanently transforming back to the way it always was, before being socially-engineered for quite a bit of time not to be.
Since the positive changes are increasing in speed and magnitude, I can only imagine what’s coming next. The return of horse and buggy in many areas, to be sure.
And the inexorable downfall of the foul regime which has ruled us from the shadows all the way back to Babylon, and before.
They’re going to disappear like frost on a spring morning.
Better yet, they’ll be transforming into more evolved versions of themselves. Evolving out of the horrible intergenerational abuse which the Salamander bloodline has been perpetuating for Millenia.
Jeff Miller, Pittsburgh, PA, July 15, 2021, edited December 20, 2023
If you’d like to be added to this free mailing list, or know someone who would be, please send me a note at [email protected]