“Don’t worry about your father. He’s a perfectly contented, self-sufficient zombie.”
From “Bluebeard”, by Kurt Vonnegut, 1987
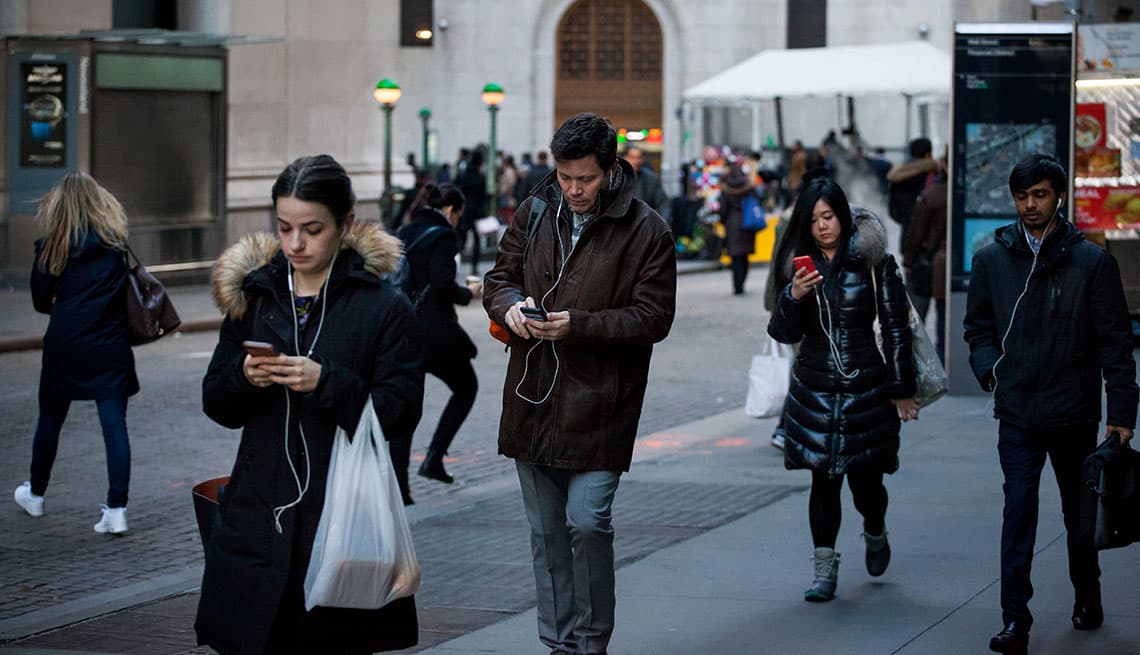
(People walking head-down with their so-called “smart” phones)
To say that there’s a lot of great new data in this collection is an understatement.
Now I will integrate it into larger, previously-published articles.
In addition to the headline, here’s one more pullout statistic:
"From June to July 2018, the 103.8% month-over-month increase in cycle movements in Auckland, New Zealand was 6,005% greater than their 1.7% long-term average monthly increase from July 2016 to October 2023.
A gigantic, unprecedented societal change for the better has taken place, accompanied by a complete Media blackout on the subject."
The health of the ether is inexorably improving, and cycling is increasing hyper-exponentially regardless of geography because moral and mental health vary directly with that of the subject’s etheric environment.
In retrospect, it’s quite obvious that the barely-covert international release in December 2019 of a Chinese bat virus weaponized at U.S. taxpayer expense by the godless Communist Red Chinese was a last ditch attempt to derail and defray the great positive societal change then currently underway.
Can you see how they have already lost?
CYCLING IN AUCKLAND, NEW ZEALAND AND ELSEWHERE, DECEMBER 2023
THE DATA
From February 2013 to January 2014, cycle movements in Auckland, New Zealand increased by 8.1%, year-over-year, to 887,691.
From February 2013 to January 2014 versus February 2021 to January 2022, year-over-year cycle movements in Auckland, New Zealand increased by 260%, or headed toward quadrupled, from 887,691 to 3.2 million.
From February 2013 to January 2014 vs. February 2021 to January 2022, the long-term year-over-year average annual increase in cycle movements in Auckland, New Zealand was 32.5%, from 887,691 to 3.2 million.
From February 2013 to January 2014 vs. February 2021 to January 2022, the long-term year-over-year average monthly increase in cycle movements in Auckland, New Zealand was 2.7%.
From March 2013 to February 2014, cycle movements in Auckland, New Zealand increased by 7.2%, year-over-year, to 887,203.
From April 2013 to March 2014, cycle movements in Auckland, New Zealand increased by 6.6%, year-over-year, to 895,165.
From May 2013 to April 2014, cycle movements in Auckland, New Zealand increased by 7.05%, year-over-year, to 897,039.
From June 2013 to May 2014, cycle movements in Auckland, New Zealand increased by 8.8%, to 909,234.
From July 2013 to June 2014, cycle movements in Auckland, New Zealand increased by 9.6%, to 915,458.
From August 2013 to July 2014, cycle movements in Auckland, New Zealand increased by 5.7%, to 900,543.
From September 2013 to August 2014, cycle movements in Auckland, New Zealand increased by 4.8%, to 895,468.
From October 2013 to September 2014, cycle movements in Auckland, New Zealand increased by 5.4%, to 899,251.
From November 2013 to October 2014, cycle movements in Auckland, New Zealand increased by 2.3%, year-over-year, to 891,245.
In December 2013 to November 2014, cycle movements in Auckland, New Zealand increased by .2%, year-over-year, to 883,031.
From January 2014 to December 2014, cycle movements in Auckland, New Zealand decreased by .8%, year-over-year, to 881,620.
In January 2014, there were 887,691 cycle movements in Auckland, New Zealand.
From February 2014 to January 2015, cycle movements in Auckland, New Zealand increased by .9%, year-over-year, to 895,586.
From February 2014 to January 2015, the 0.9% year-over-year increase in cycle movements in Auckland, New Zealand was 88.8% less than their 8.1% year-over-year increase from February 2013 to January 2014.
From March 2014 to February 2015, cycle movements in Auckland, New Zealand increased by 1.5%, year-over-year, to 900,531.
From April 2014 to March 2015, cycle movements in Auckland, New Zealand increased by .8%, year-over-year, to 902,343.
From May 2014 to April 2015, cycle movements in Auckland, New Zealand increased by .9%, year-over-year, to 904,901.
From June 2014 to May 2015, cycle movements in Auckland, New Zealand decreased by .8%, year-over-year, to 902,343.
From July 2014 to June 2015, cycle movements in Auckland, New Zealand decreased by 1%, year-over-year, to 906,518.
From August 2014 to July 2015, cycle movements in Auckland, New Zealand increased by 1.2%, year-over-year, to 911,350.
From September 2014 to August 2015, cycle movements in Auckland, New Zealand increased by 2.26%, year-over-year, to 915,664.
From October 2014 to September 2015, cycle movements in Auckland, New Zealand increased by 2.27%, year-over-year, to 919,703.
From November 2014 to October 2015, cycle movements in Auckland, New Zealand increased by 3.7%, year-over-year, to 924,286.
From December 2014 to November 2015, cycle movements in Auckland, New Zealand increased by 5.6%, year-over-year, to 911,350.
From January to December 2015 to January to December 2016, cycle movements in Auckland, New Zealand increased by 84%, or close to doubled, from 911,350 to 1.68 million.
From January 2015 to December 2015, cycle movements in Auckland, New Zealand increased by 7.4%, year-over-year, to 946,749.
In January 2015, cycling movements in Auckland, New Zealand increased by 16.4%, year-over-year.
From February 2015 to January 2016, cycle movements in Auckland, New Zealand increased by 5.1%, year-over-year, to 941,166.
From February 2015 to January 2016, the 5.1% year-over-year increase in cycle movements in Auckland, New Zealand was 466% greater, or heading toward six times greater than their 0.9% average annual increase from February 2014 to February 2015.
From March 2015 to February 2016, cycle movements in Auckland, New Zealand increased by 5.2%, year-over-year, to 947,413.
From April 2015 to March 2016, cycle movements in Auckland, New Zealand increased by 5.7%, year-over-year, to 954,153.
From May 2015 to April 2016, cycle movements in Auckland, New Zealand increased by 7.2%, year-over-year, to 946,749.
From August 2015 to July 2016, cycle movements in Auckland, New Zealand increased by 8.1%, year-over-year, to 1,710,000.
From May 2015 to July 2016 vs. August 2015 to July 2016, cycle movements in Auckland, New Zealand increased by 80.6%, or almost doubled, from 946,749 to 1,710,000. That’s a month-over-month increase of 763,251 cycle movements.
From September 2015 to August 2016, cycle movements in Auckland, New Zealand increased by 8.8%, year-over-year, to 1,610,000.
From September to October 2015, cycle movements in the city center of Auckland New Zealand increased by 23%, from 1,610,000 to 1,750,000.
From October 2015 to September 2016, cycle movements in Auckland, New Zealand increased by 8.8%, year-over-year, to 1.66 million.
From October 2015 to September 2016, 1.75 million cycle movements were recorded cycle movements in the city center of Auckland, New Zealand.
From November 2015 to October 2016, cycle movements in Auckland, New Zealand increased by 8.9%, year-over-year, to 1.67 Million.
From November 2015 to October 2016, the 1.76 million cycle movements recorded in the city center of Auckland, New Zealand were .6% greater than the 1.75 million cycle movements there from October 2015 to September 2016.
From November 2015 to October 2016, 1.76 million cycle movements were recorded in the city center of Auckland, New Zealand.
From December 2015 to November 2016, cycle movements in Auckland, New Zealand increased by 8.5%, year-over-year, to 1.67 million.
From December 2015 to November 2016, there were 1.77 million cycle movements in the city center of Auckland, New Zealand.
From January to December 2016 to January to December 2017, cycle movements in Auckland, New Zealand increased by 8.8%, from 1.68 million to 1.827 million.
From January to December 2016, cycle movements in Auckland, New Zealand increased by 7.2%, year-over-year, to 1.68 million.
From January to December 2016, there were 1.76 million cycle movements in the city center of Auckland, New Zealand.
In January 2016, cycle movements in Auckland, New Zealand decreased by 5.3%, year-over-year.
From February 2016 to January 2017, cycle movements in Auckland, New Zealand increased by 8.8%, year-over-year, to 1.700 million.
From February 2016 to January 2017, the 8.8% year-over-year increase in cycle movements in Auckland, New Zealand was 72.5% greater, or heading toward double their 5.1% year-over-year increase from February 2015 to January 2016.
From February 2016 to January 2017, there were 1.764 million cycle movements in the city center of Auckland, New Zealand
In February 2016, cycle movements in Auckland, New Zealand increased by 6.4%, year-over-year.
In February 2016, cycle movements in the center city of Auckland, New Zealand increased by 1.8%, year-over-year, to 164,346.
From March 2016 to February 2017, cycle movements in Auckland, New Zealand increased by 8.8%, year over year, to 1.710 million.
From March 2016 to February 2017, there were 1.761 million cycle movements in the city center of Auckland, New Zealand.
In March 2016, cycle movements in Auckland, New Zealand increased by 7.0%, year-over-year.
From April 2016 to March 2017, there were 1.752 million cycle movements in the city center of Auckland, New Zealand.
From April 2016 to March 2017, cycle movements in Auckland, New Zealand increased by 8.6%, to 1.716 million.
In April 2016, cycle movements in Auckland, New Zealand increased by 19.3%, year-over-year, to 946,749.
From May 2016 to April 2017, cycle movements in Auckland, New Zealand increased by 6.8%, year-over-year, to 1.713 million.
In May 2016, cycle movements in Auckland, New Zealand increased by 22.6%, year-over-year.
From June 2016 to May 2017, cycle movements in Auckland, New Zealand increased by 6.4%, year-over-year, to 1.727 million.
From June 2016 to May 2017, there were 1.746 million cycle movements in the city center of Auckland, New Zealand.
In June 2016, cycle movements in Auckland, New Zealand increased by 15.1%, year-over-year.
In July 2016, cycle movements in Auckland, New Zealand increased by 11.3%, year-over-year, to 110,822.
From July 2016 to October 2023, monthly cycle movements in Auckland, New Zealand increased by 145.6%, or well more than doubled, from 110,822 to 272,198.
From July 2016 to October 2023, monthly cycle movements in Auckland, New Zealand increased by a monthly average of 1.7%.
From July 2016 to June 2017, cycle movements in Auckland, New Zealand increased by 6.8%, year-over-year, to 1.742 million.
From July 2017 to June 2017, there were 1.761 million cycle movements in the city center of Auckland, New Zealand.
From July 2016 to August 2016, cycling movements in the city center of Auckland, New Zealand increased by 13%, from 115,518 to 130,523.
In July 2016, 115,518 cycle movements were recorded in the city center of Auckland, New Zealand.
From August 2016 to July 2017, cycle movements in Auckland, New Zealand increased by 6.3%, year-over-year, to 1.746 million.
From August 2016 to July 2017, there were 1.762 million cycle movements in the city center of Auckland, New Zealand.
From August to September 2016, cycle movements in the city center of Auckland, New Zealand decreased by 6%, from 130,523 to 122,697.
In August 2016, cycle movements at 14 regional count sites in Auckland, New Zealand increased by 13.9%, year-over-year, to 123,388.
In August 2016, 130,523 cycle movements were recorded in the city center of Auckland, New Zealand.
From September 2016 to August 2017, cycle movements in Auckland, New Zealand increased by 5.9%, year-over-year, to 1.755 million.
From September 2016 to August 2017, there were 1.770 million cycle movements in the city center of Auckland, New Zealand.
From September 2016 to October 2016, cycle movements in the city center of Auckland, New Zealand increased by 17.4%, from 122,679 to 144,017.
In September 2016, 122,697 cycle movements were recorded in the city center of Auckland, New Zealand.
From October 2016 to September 2017, cycle movements in Auckland, New Zealand increased by 6.1%, year-over-year, to 1.764 million.
From October 2016 to September 2017, there were 1.774 million cycle movements in the city center of Auckland, New Zealand.
In October 2016, 144,017 cycle movements were recorded in the city center of Auckland, New Zealand.
In October 2016, cycle movements in Auckland, New Zealand increased by 7%, year-over-year, to 145,039.
October 2016, there were 145,039 cycle movements in Auckland, New Zealand.
From October to November 2016, cycle movements in the city center of Auckland, New Zealand increased by 2.5%, from 144,017 to 147,648.
From November 2016 to October 2017, cycle movements in Auckland, New Zealand increased by 5.7%, year-over-year, to 1.768 million.
From November 2016 to October 2017, there were 1.777 million cycle movements in the city center of Auckland, New Zealand.
In November 2016, 147,648 cycle movements were recorded in the city center of Auckland, New Zealand.
In November 2016, cycle movements in the city center of Auckland, New Zealand increased by 12.8%, year-over-year, to 147,468.
From December 2016 to November 2017, cycle movements in Auckland, New Zealand increased by 7%, year-over-year, to 1.796 million.
From December 2016 to November 2017, cycle movements in the city center of Auckland, New Zealand increased by 1.3%, year-over-year, to 1.806 million.
In December 2016, cycle movements in the city center of Auckland, New Zealand increased by 12.4%, year-over-year, to 145,826.
In December 2016, cycle movements in Auckland, New Zealand increased by 2.9%, year-over-year, to 145,097.
From January to December 2017, cycle movements in the city center of Auckland, New Zealand increased by 3.7%, year-over-year, to 1.827 million.
From January to December 2017 to January to December 2018, cycle movements in Auckland, New Zealand increased by 94%, or almost doubled, from 1.827 million to 3.546 million.
From January to December 2017, cycle movements in Auckland, New Zealand increased by 7.9%, year-over-year to 1.818 million.
In January 2017, cycle movements in the city center of Auckland, New Zealand increased by 1.3%, to 162,055.
In January 2017, cycle movements in Auckland, New Zealand increased by 9.6%, year-over-year.
From February 2017 to January 2018, cycle movements in the city center of Auckland, New Zealand increased by 3.7%, year-over-year, to 1.829 million.
From February 2017 to January 2018, cycle movements in Auckland, New Zealand increased by 6.8%, year-over-year, to 1.815 million.
From February 2017 to January 2018, the 6.8% year-over-year increase in cycle movements in Auckland, New Zealand was 22.7% less than their 8.8% year-over-year increase from February 2016 to January 2018.
In February 2017, cycle movements in Auckland, New Zealand increased by 6.7%, year-over-year, to 170,452.
From March 2017 to February 2018, cycle movements in Auckland, New Zealand increased by 5.6%, year-over-year.
From March 2017 to February 2018, cycle movements in the city center of Auckland, increased by 3.7%, to 1.826 million.
In March 2017, cycle movements in Auckland, New Zealand increased by 3.6%, year-over-year, to 172,272.
In March 2017, cycle movements in the city center of Auckland, New Zealand decreased by 4.8%, year-over-year (“note that the Lightpath was closed from 1-7 March”).
From April 2017 to March 2018, cycle movements in Auckland, New Zealand increased by 6.0%, year-over-year, to 1.818 million.
From April 2017 to March 2018, cycle movements in the city center of Auckland, increased by 5.4%, year-over-year, to 1.846 million.
In April 2017, cycle movements in Auckland, New Zealand decreased by 1.4%, to 154,645.
From May 2017 to April 2018, cycle movements in the city center of Auckland, New Zealand increased by 6.7%, year-over-year, to 1.853 million.
From May 2017 to April 2018, cycle movements in Auckland, New Zealand increased by 5.9%, year-over-year, to 1.815 million.
In May 2017, cycle movements in Auckland, New Zealand increased by 9.2%, year-over-year, to 154,342.
In May 2017, cycle movements in the city center of Auckland, New Zealand increased by 6.0%, year-over-year, to 162,628.
From June 2017 to May 2018, cycle movement in the city center of Auckland, New Zealand increased by 6.4%, year-over-year, to 1.858 million.
From June 2017 to May 2018, cycle movements in Auckland, New Zealand increased by 5.3%, year-over-year, to 1.818 million.
In June 2017, cycle movements in Auckland, New Zealand increased by 13.3%, year-over-year, to 134,026.
In June 2017, cycle movements in the city center of Auckland, New Zealand increased by 12.3%, year-over-year, to 136,138.
From July 2017 to June 2018, cycle movements in the city center of Auckland, New Zealand increased by 4.8%, year-over-year, to 1.845 million.
From July 2017 to June 2018, cycle movements in Auckland, New Zealand increased by 3.7%, to 1.807 million.
In July 2017, cycle movements in the city center of Auckland, New Zealand increased by .9%, year-over-year, to 117,602.
In July 2017, cycle movements in Auckland, New Zealand increased by 3.7%, year-over-year, to 114,871.
From August 2017 to July 2018, cycle movements in Auckland, New Zealand increased by 5.2%, to 3.496 million.
From August 2017 to July 2018, the 3.496 million cycle movements in Auckland, New Zealand were 93.5% greater, or almost double the 1.807 million cycle movements there from July 2017 to January 2018.
In August 2017, cycle movements in the city center of Auckland, New Zealand increased by 6.1%, year-over-year to 139,785.
In August 2017, cycle movements in Auckland, New Zealand increased by 6.8%, year-over-year, to 131,751.
From September 2017 to August 2018, cycle movements in Auckland, New Zealand increased by 4.9%, year-over-year, to 3.501 million.
In September 2017, cycle movements in Auckland, New Zealand increased by 8.0%, year-over-year, to 128,665.
In September 2017, cycle movements in the city center of Auckland, New Zealand increased by 3.8%, year-over-year, to 128,519.
From October 2017 to September 2018, cycle movements in Auckland, New Zealand increased by 5.6%, year-over-year, to 3.539 million.
In October 2017, cycle movements in the city center of Auckland, New Zealand increased by 1.6%, year-over-year, to 147,516.
In October 2017, cycle movements in Auckland, New Zealand increased by 2.8%, year-over-year, to 149,140.
From November 2017 to October 2018, cycle movements in Auckland, New Zealand increased by 6.8%, year-over-year, to 3.587 million.
In November 2017, the 19.4% year-over-year increase in cycle movements in the city center of Auckland, New Zealand was 592% greater, or almost seven times greater than their 2.8% year-over-year increase in October 2017.
In November 2017, cycle movements in the city center of Auckland, New Zealand increased by 19.4%, year-over-year, to 177,574.
In November 2017, cycle movements in Auckland, New Zealand increased by 18.9%, year-over-year, to 172,888.
From December 2017 to November 2018, cycle movements in Auckland, New Zealand increased by 4.7%, year-over-year, to 3.574 million.
In December 2017, cycle movements in the city center of Auckland, New Zealand increased by 14.5%, year-over-year, to 166,919.
In December 2017, cycle movements in Auckland, New Zealand increased by 14.9%, year-over-year, to 168,452.
From January to December 2018, cycle movements in Auckland, New Zealand increased by 2.6%, year-over-year, to 3.546 million.
In January 2018, cycle movements in the city center of Auckland, New Zealand increased by 1.3%, to 164,140.
In January 2018, there were 163,657 cycle movements in Auckland, New Zealand.
In January 2018, cycle movements in Auckland, New Zealand decreased by 1.5%, year-over-year, to 163,657.
From February 2018 to January 2019, cycle movements in Auckland, New Zealand increased by 4%, year-over-year, to 3.593 million.
In February 2018, cycle movements in Auckland, New Zealand decreased by 5.4%, year-over-year, to 161,167.
In February 2018, cycle movements in the city center of Auckland, New Zealand decreased by 1.9%, year-over-year, to 161,171.
From March 2018 to February 2019, cycle movements in Auckland, New Zealand increased by 6.2%, year-over-year, to 3.65 million.
In March 2018, cycle movements in the city center of Auckland, New Zealand increased by 11.8%, year-over-year, to 193,530.
In March 2018, cycle movements in Auckland, New Zealand increased by 7.3%, to 184,810.
From April 2018 to March 2019, cycle movements in Auckland, New Zealand increased by 6.0%, year-over-year, to 3.68 million.
In April 2018, cycle movements in the city center of Auckland, New Zealand increased by 4.4%, year-over-year, to 157,397.
In April 2018, cycle movements in Auckland, New Zealand decreased by 2.0%, year-over-year, to 151,552.
From May 2018 to April 2019, cycle movements in Auckland, New Zealand increased by 6.5%, year-over-year, to 3.70 million.
In May 2018, cycle movements in the city center of Auckland, New Zealand increased by 4.4%, year-over-year, to 168,152.
In May 2018, cycle movements in Auckland, New Zealand increased by 1.7%, year-over-year, to 156,971.
From June 2018 to May 2019, cycle movements in Auckland, New Zealand increased by 7.1%, year-over-year, to 3.70 million.
From June to July 2018, cycle movements in Auckland, New Zealand increased by 103.8%, or doubled, from 123,116 to 251,000. That’s an increase of 127,844 cycle movements, in one month.
From June to July 2018, the 103.8% month-over-month increase in cycle movements in Auckland, New Zealand was 6,005% greater than their 1.7% long-term average monthly increase from July 2016 to October 2023.
A gigantic, unprecedented societal change for the better has taken place, accompanied by a complete Media blackout on the subject.
In retrospect, it’s quite obvious that the barely-covert international release in December 2019 of a Chinese bat virus weaponized at U.S. taxpayer expense by the godless Communist Red Chinese was a last ditch attempt to derail and defray the great positive societal change then currently underway.
In June 2018, cycle movements in the city center of Auckland, New Zealand decreased by 9.6%, year-over-year, to 123,125.
In June 2018, cycle movements in Auckland, New Zealand decreased by 8.1%, year-over-year, to 123,116.
From July 2018 to June 2019, cycle movements in Auckland, New Zealand increased by 8.9%, year-over-year, to 3.77 million.
In July 2018, cycle movements in Auckland, New Zealand increased by 15%, year-over-year, to 251,000.
From August 2018 to July 2019, cycle movements in Auckland, New Zealand increased by 8.3%, year-over-year, to 3.79 million.
In August 2018, cycle movements in Auckland, New Zealand increased by 2.0%, to 261,000.
From September 2018 to August 2019, cycle movements in Auckland, New Zealand increased by 7.3%, to 3.76 million.
In September 2018, cycle movements in Auckland, New Zealand increased by 15.5%, year-over-year, to 281,000.
From October 2018 to September 2019 cycle movements in Auckland, New Zealand increased by 5.9%, year-over-year, to 3.75 million.
In October 2018, cycle movements in Auckland, New Zealand increased by 17.1%, year-over-year, to 329,000.
From November 2018 to October 2019, cycle movements in Auckland, New Zealand increased by 3.8%, year-over-year, to 3.72 million.
In November 2018, cycle movements in Auckland, New Zealand decreased by 4.0%, year-over-year, to 320,000.
From December 2018 to November 2019, cycle movements in Auckland, New Zealand increased by 5.0%, to 3.75 million.
From December 2018 to January 2019, cycle movements in Auckland, New Zealand increased by 23.6%, month-over-month, from 292,000 to 361,000. That’s an addition of 69,000 cycle movements in one month.
In December 2018, cycle movements in Auckland, New Zealand decreased by 9.0%, year-over-year, to 292,000.
From January to December 2019, cycle movements in Auckland, New Zealand increased by 6.2%, year-over-year, to 3.77 million.
In January 2019, cycle movements in Auckland, New Zealand increased by 15.1%, year-over-year, to 361,000.
From February 2019 to January 2020, cycle movements in Auckland, New Zealand increased by 4.7%, year-over-year, to 3.76 million.
In February 2019, cycle movements in Auckland, New Zealand increased by 20%, year-over-year, to 368,000.
From March 2019 to March 2020, cycle movements in Auckland, New Zealand increased by 2.1%, year-over-year, to 3.8 million.
In March 2019, cycle movements in Auckland, New Zealand increased by 8.3%, year-over-year, to 388,000.
In April 2019, cycle movements in Auckland, New Zealand increased by 6.0%, year-over-year to 311,000.
From May 2019 to May 2020, cycle movements in Auckland, New Zealand decreased by 1.6%, year-over-year, to 3.7 million. At.govt.nz said in comment “Due to the Covid-19 situation, the commuter cyclist movements have decreased significantly after the lockdown, due to increased wet weather conditions, recreational cycle movements did not reach the levels of previous months.”
For those keeping score, a 1.6% year-over-year decrease is not “significant”.
In May 2019, cycle movements in Auckland, New Zealand increased by 10.1%, year-over-year, to 337,000.
In June 2019, cycle movements in Auckland, New Zealand increased by 16.7%, year-over-year, to 272,000.
From July 2019 to June 2020, cycle movements in Auckland, New Zealand increased by 2.9%, year-over-year to 3.7 million. At.govt.nz said in comment “During Alert levels 2 and then 1, commuter cycling increased compared to May 2020, but did not reach the expected levels.”
Wow! We’ve gone from the false claim that cycling decreased by 50% during the lockdown to this uncomfortable pile of claptrap, which has to deal with the resumption of the meteoric increase in cycling in Auckland, New Zealand, despite the government’s most-fervent efforts at social engineering to stop that increase.
In July 2019, cycle movements in Auckland, New Zealand increased by 5.9%, to 266,000.
From August 2019 to July 2020, cycle movements in Auckland, New Zealand decreased by 3.8%, year-over-year, to 3.65 million.
In August 2019, cycle movements in Auckland, New Zealand decreased by 11.2%, year-over-year, to 232,000. Note: Auckland’s 190 mm of rainfall in August 2019 was 95.9% greater, or basically double its long-term average 97 mm. At.govt.nz withheld the percentage, and described it only-generally as “a very wet August”.
From September 2019 to August 2020, cycle movements in Auckland, New Zealand decreased by 1.4%, to 3.7 million.
In September 2019, cycle movements in Auckland, New Zealand decreased by 3.8%, year-over-year, to 270,000. Note: Auckland’s 125 mmm of rainfall in September 2019 was 95.3% greater, or basically double its long-term average of 64mm. At. govt.nz withheld the percentage and described it only-generally as “another wet month”.
From October 2019 to September 2020, cycle movements in Auckland, New Zealand decreased by 0.8%, to 3.7 million.
From October to November 2019, cycle movements in Auckland, New Zealand increased by 14.8%, month-over-month, from 305,000 to 350,000.
In October 2019, cycle movements in Auckland, New Zealand decreased by 7.3%, year-over-year, to 305,000.
From November 2019 to October 2020, cycle movements in Auckland, New Zealand increased by 0.5%, year-over-year, to 3.7 million.
In November 2019, cycle movements in Auckland, New Zealand increased by 9.3%, year-over-year to 350,000.
From December 2019 to November 2020, cycle movements in Auckland, New Zealand decreased by 1.8%, to 3.7 million.
From December 2019 to January 2020, cycle movements in Auckland, New Zealand increased by 17.7%, month-over-month, from 305,000 to 359,000. That’s an additional 55,000 cycle movements, in one month.
In December 2019, cycle movements in Auckland, New Zealand increased by 4.5%, year-over-year, to 305,000.
From 2020 to 2023, cyclingauthority.com’s John Swanstrom said that the average annual increase in the global bicycle market would be 1.08%.
From January 2020 to December 2020, cycle movements in Auckland, New Zealand decreased by 2.6%, year-over-year, to 3.7 million.
3.7 million cycle movements were recorded for the year of January 2020 to December 2020, a decrease of 2.6% on the previous 12 months.
From January to February 2020, cycle movements in Auckland, New Zealand increased by 13.6%, month-over-month, from 359,000 to 408,000. That’s an additional 49,000 cycle movements, in one month.
In January 2020, cycle movements in Auckland, New Zealand decreased by 0.6%, year-over-year, to 359,000.
From February 2020 to January 2021, cycle movements in Auckland, New Zealand decreased by 3.9%, to 3.6 million.
From February to April 2020, cycle movements in Auckland, New Zealand decreased by 26.9%, from 408,000 to 298,000.
From February to March 2020, cycle movements in Auckland, New Zealand decreased by 12.99%, from 408,000 to 355,000.
In February 2020, cycle movements in Auckland, New Zealand increased by 11%, year-over-year, to 408,000.
From March 2020 to March 2023, spending on bicycles and accessories in the United States increased by 620%. The uncredited Intelligence operative from bts.gov said that it was “notable”, and offered no suggestion as to why the hyper-exponential increase might have taken place. The latter is an example of the propaganda technique known as “stonewalling”.
From March 2020 to February 2023, the total value of non-motorized bicycles imported into the United States increased by 18,000% from $500,000 to $1,000,000,000.
From March 2023 to February 2023, the average annual increase in the total value of non-motorized bicycles imported into the United States was 6,000%. While we learned previously that cyclingauthority.com’s John Swanstrom said that the average annual increase in the global bicycle market from 2020 to 2023 would be 1.08%.
From March 2020 to March 2023, the actual 6,000% average annual increase in the total value of non-motorized bicycles imported into the United States was 555,455% greater than the 1.08% average annual increase in the global bicycle market from 2020 to 2023 projected by cyclingauthority.com’s John Swanstrom. Put another way, John falsely downgraded the actual 6,000% average annual increase by 555,455% to a fraudulent 1.08% projected increase.
Cyclingauthority.com’s John Swanstrom is a pathologically-lying generational Satanist Freemason. I have exposed his duplicity by using what was known in the old days as “fact checking".
Here’s John Swanstrom’s picture, in a Satanic purple cycling jersey:

(John Swanstrom)
I have included his picture so that you could get a better idea of what a generational Satanist Freemason in a position of marginal influence looks like.
They are all related to one another through the maternal bloodline. They comprise roughly twenty percent of the populace, and are hiding in plain sight in every city, town and village on Earth.
It’s how the few have controlled the many all the way back to Babylon, and before.
But they say that the hardest part of solving a problem is recognizing that you have one.
Don Croft used to say “Parasites fear exposure above all else”.
From March 2020 to February 2021, cycle movements in Auckland, New Zealand decreased by 7.5%, year-over-year, to 3.5 million.
In March 2020, cycle movements in Auckland, New Zealand, decreased by 8%, year-over-year, to 355,000. At.govt.nz said “Due to the Covid-19 situation, the commuter cyclist movements have decreased significantly after the lockdown, but recreational cyclist movements have increased in residential areas. Overall cycling demand reduced by approximately 50% after the lockdown.” When, in fact, cycle movements in Auckland, New Zealand decreased by 13% from February to March 2020, month-over-month.
The government of New Zealand has falsely exaggerated the decrease by 284%, or by almost four times, from an actual 13% to a fraudulent 50%.
And did you notice the sleight-of-hand where “cycling movements” was deftly switched to “cycling demand”?
To make matters worse for the serially-lying sociopaths, from January 2020 to December 2020, during the “great plague of Covid”, cycle movements in Auckland, New Zealand decreased by just 2.6%, year-over-year, to 3.7 million. Compare that fact with this propaganda: “Overall cycling demand reduced by approximately 50% after the lockdown.”
I have exposed the duplicity of the bike Feds in New Zealand by using what was known in the old days as “fact checking”.
From April 2020 to March 2021, cycle movements in Auckland, New Zealand decreased by 7.7%, year-over-year, to 3.5 million.
In April 2020, cycle movements in Auckland, New Zealand decreased by 4%, year-over-year, to 298,000. At.govt.nz said “Due to the Covid-19 situation, the commuter cyclist movements have decreased significantly after the lockdown, but recreational cyclist movements have increased in residential areas.”
Wait, what? People are afraid to commute to work in the city of Auckland, but aren’t afraid to ride recreationally in the city of Auckland? That’s a brazenly false claim.
The truth is that everybody claimed to be afraid, and used it as an excuse to “work remotely” (which means doing as little work as possible without getting fired) and used the rest of the time to play video games and binge-watch Netflix. Then they went for recreational bike rides.
From May 2020 to April 2021, cycle movements in Auckland, New Zealand decreased by 7.7%, year-over-year, to 3.5 million.
In May 2020, cycle movements in Auckland, New Zealand decreased by 24%, year-over-year, to 258,000. At.govt.nz said “Due to the Covid-19 situation, the commuter cyclist movements have decreased significantly after the lockdown, due to increased wet weather conditions, recreational cycle movements did not reach the levels of previous months.”
Here, it is brazenly and falsely alleged that only commuters were afflicted with fear of barely-covert international release of the Chinese bat virus weaponized at U.S. taxpayer expense, while recreational riders, unafraid of the deadly, slate-wiper virus nevertheless pussed out because it was raining.
With the truth being that record rainfall in Auckland was the primary driver of the 24% year-over-year decrease in cycling movements there in May 2020.
Did you notice how the Feds in New Zealand didn’t provide any metrics about the record rainfall, and, further, did not mention anything about what might be causing it? Those are examples of the propaganda technique known as “stonewalling”.
In June 2020, cycle movements in Auckland, New Zealand decreased by 4%, year-over-year, to 262,000. At.govt.nz said in comment “During Alert levels 2 and then 1, commuter cycling increased compared to May 2020, but did not reach the expected levels.”
Wait, what? Previously, the bike Feds in New Zealand said, only-generally, that commuter cyclist movements had “decreased significantly after lockdown, while recreational riders somehow increased during the same time period. Yet, here, we have a sudden, albeit non-quantified increase
From July 2020 to June 2021, cycle movements in Auckland, New Zealand decreased by 5%, year-over-year, to 3.5 million.
In July 2020, cycle movements in Auckland, New Zealand decreased by 7.2%, year-over-year, to 247,000.
In August 2020, cycle movements in Auckland, New Zealand increased by 23.6%, year-over-year, to 287,000.
From September 2020 to August 2021, cycle movements in Auckland, New Zealand decreased by 7.5%, year-over-year, to 3.4 million.
From September to October 2020, cycle movements in Auckland, New Zealand increased by 17%, month-over-month, from 282,000 to 330,000. That’s an additional 48,000 cycle movements, in one month.
Hey, wait a minute. What gives? I thought that the Chinese bat virus weaponized at U.S. taxpayer expense by the godless Communist Red Chinese was a slate-wiper, putting everybody on ventilators, and such and such?
In September 2020, cycle movements in Auckland, New Zealand increased by 4.5%, year-over-year, to 282,000.
From October 2020 to September 2021, cycle movements in Auckland, New Zealand decreased by 8.7%, year-over-year, to 3.4 million.
In October 2020, cycle movements in Auckland, New Zealand increased by 8.3%, year-over-year, to 330,000.
From November 2020 to October 2021, cycle movements in Auckland, New Zealand decreased by 11.2%, year-over-year, to 3.3 million.
In November 2020, cycle movements in Auckland, New Zealand, cycle movements in Auckland, New Zealand decreased by 16.8%, year-over-year, to 291,482.
From December 2020 to November 2021, cycle movements in Auckland, New Zealand decreased by 10.4%, year-over-year, to 3.3 million.
In December 2020, cycle movements in Auckland, New Zealand decreased by 5.4%, year-over-year, to 288,466.
From January 2021 to December 2022 versus January 2022 to December 2022, cycle movements in Auckland, New Zealand decreased by 9.7%, from 3.2 million to 2.89 million.
From January to December 2021, cycle movements in Auckland, New Zealand decreased by 11.4%, year-over-year, to 3.2 million.
From January to December 2020 to January to December 2021, cycle movements in Auckland, New Zealand decreased by 13.5%, from 3.7 million to 3.2 million.
In January 2021, cycle movements in Auckland, New Zealand decreased by 13.8%, year-over-year, to 309,387.
From February 2021 to January 2022, cycle movements in Auckland, New Zealand decreased by 11.5%, year-over-year, to 3.2 million.
In February 2021, cycle movements in Auckland, New Zealand decreased by 24.2%, to 309,716.
From March 2021 to February 2022, cycle movements in Auckland, New Zealand decreased by 10.9%, year-over-year, to 3.1 million.
3.1 million cycle movements were recorded for the year of March 2021 to February 2022, a decrease of 10.9% on the previous 12 months.
In March 2021, cycle movements in Auckland, New Zealand decreased by 10.5%, year-over-year, to 317,975.
From April 2021 to March 2022, cycle movements in Auckland, New Zealand decreased by 11.2%, year-over-year, to 3.1 million.
In April 2021, cycle movements in Auckland, New Zealand decreased by 3.6%, year-over-year, to 288,097.
From May 2021 to April 2022, cycle movements in Auckland, New Zealand decreased by 12.1%, year-over-year, to 3.1 million.
From June 2021 to May 2022, cycle movements in Auckland, New Zealand decreased by 13.6%, year-over-year, to 3.0 million.
In June 2021, cycle movements in Auckland, New Zealand decreased by 6.0%, year-over-year, to 245,618.
From July 2021 to June 2022, cycle movements in Auckland, New Zealand decreased by 14.4%, year-over-year, to 2.98 million.
In July 2021, cycle movements in Auckland, New Zealand increased by 1%, year-over-year, to 248,991.
From August 2021 to July 2022, cycle movements in Auckland, New Zealand decreased by 16.1%, year-over-year, to 2.92 million.
In August 2021, cycle movements in Auckland, New Zealand decreased by 21%, year-over-year, to 226,362.
From September 2021 to August 2022, cycle movements in Auckland, New Zealand decreased by 14.5%, to 2.93 million.
In September 2021, cycle movements in Auckland, New Zealand decreased by 11.7%, year-over-year, to 249,038.
From October 2021 to September 2022, cycle movements in Auckland, New Zealand decreased by 14.1%, year-over-year, to 2.92 million.
In October 2021, cycle movements in Auckland, New Zealand decreased by 20.9%, year-over-year, to 261,096.
From November 2021 to October 2022, cycle movements in Auckland, New Zealand decreased by 12.5%, year-over-year, to 2.91 million.
In November 2021, cycle movements in Auckland, New Zealand decreased by 7.9%, year-over-year, to 268,546.
From December 2021 to November 2022, cycle movements in Auckland, New Zealand decreased by 12.3%, year-over-year, to 2.90 million.
2.90 million cycle movements were recorded for the year of December 2021 to November 2022 a decrease of 12.3% on the previous 12 months.
In December 2021, cycle movements in Auckland, New Zealand decreased by 18.8%, to 234,184.
From January 2022 to March 2023, cycle movements in Auckland, New Zealand increased by 16.3%, from 234,184 to 272,302.
In January 2022, cycle movements in Auckland, New Zealand decreased by 18.8%, year-over-year, to 234,184.
From February 2022 to March 2023, cycle movements in Auckland, New Zealand decreased by 3.0%, year-over-year, to 3.0 million.
In February 2022, cycle movements in Auckland, New Zealand decreased by 21.1%, year-over-year, to 244,422.
From March 2022 to February 2023, cycle movements in Auckland, New Zealand decreased by 7.6%, year-over-year, to 2.90 million.
From March 2022 to April 2023, cycle movements in Auckland, New Zealand decreased by 1.1%, year-over-year, to 3.0 million.
In March 2022, cycle movements in Auckland, New Zealand decreased by 14.4%, year-over-year, to 272,302.
From April 2022 to May 2023, cycle movements in Auckland, New Zealand decreased by 0.4%, year-over-year, to 3.0 million.
In April 2022, cycle movements in Auckland, New Zealand decreased by 13.8%, year-over-year, to 248,393.
In May 2022, cycle movements in Auckland, New Zealand decreased by 9.2%, year-over-year, to 261,756.
In June 2022, cycle movements in Auckland, New Zealand decreased by 17.4%, year-over-year, to 202,830.
From July 2022 to June 2023, cycle movements in Auckland, New Zealand increased by 2.1%, year-over-year, to 3.043 million.
In July 2022, cycle movements in Auckland, New Zealand decreased by 22.5%, year-over-year, to 192,950.
From August 2022 to September 2023, cycle movements in Auckland, New Zealand increased by 7.2%, year-over-year, to 3.13 million.
From August 2022 to July 2023, cycle movements in Auckland, New Zealand increased by 5.1%, to 3.07 million.
In August 2022, at.govt.nz said “231,082 cycle movements were recorded in May 2021, 2.1% increase compared to August 2021.” We must presume that “in May 2021” is an error. We know that, in August 2021, there were 226,362 cycle movements in Auckland, New Zealand.
In August 2022, cycle movements in Auckland, New Zealand increased by 2%, year-over-year, from 226,362 to 231,082.
From September 2022 to October 2023, cycle movements in Auckland, New Zealand increased by 8.1%, year-over-year, to 3.14 million.
From September 2022 to August 2023, cycle movements in Auckland, New Zealand increased by 5.1%, year-over-year, to 3.11 million.
In September 2022, at.govt.nz said “234,300 cycle movements were recorded in September 2021, 5.9% decrease compared to September 2021. We must presume that “in September 2021” is an error. We know that, in September 2021, there were 249,038 cycle movements in Auckland, New Zealand.
In September 2022, cycle movements in Auckland, New Zealand decreased by 6%, year-over-year, from 249,038 to 234,000.
In October 2022, at.govt.nz said “253,992 cycle movements were recorded in October 2021, 2.7% decrease compared to October 2021.” Where the first “October 2021” is an error. We know that there were 261,096 cycle movements in Auckland, New Zealand in October 2021.
In October 2022, cycle movements in Auckland, New Zealand decreased by 2.7%, from 261,096 to 253,992.
In November 2022, cycle movements in Auckland, New Zealand decreased by 4.6%, to 256,138.
In December 2022, cycle movements in Auckland, New Zealand decreased by 3.4%, to 226,238.
In December 2022, at.govt.nz said “2.89 million cycle movements were recorded for the year of January 2021 to December 2022 a decrease of 11.1% on the previous 12 months.”
Where “January 2021” is an error. We know that 3.2 million cycle movements were recorded for the year of January 2021 to December 2021.
In January 2023, cycle movements in Auckland, New Zealand decreased by 9.6%, year-over-year, to 238,651.
In February 2023, cycle movements in Auckland, New Zealand increased by 14.7%, year-over-year, to 280,394.
In March 2023, cycle movements in Auckland, New Zealand increased by 36.1%, year-over-year, from 272,302 to 370,592. That’s an additional 98,290 cycle movements.
In March 2023, the 36.1% year-over-year increase in cycle movements in Auckland, New Zealand was 145.5% greater, or well more than double their 14.7% year-over-year increase in February 2023.
The great positive societal change is increasing hyper-exponentially, going forward in time.
That’s because the health of the ether is increasing, and moral and mental health vary directly with that of the subject’s etheric environment.
In April 2023, cycle movements in Auckland, New Zealand increased by 8.2%, year-over-year, to 268,768.
In May 2023, cycle movements in Auckland, New Zealand decreased by 2.4%, year-over-year, to 255,498.
In June 2023, cycle movements in Auckland, New Zealand increased by 15.8%, year-over-year, to 238,841.
In June 2023, the 15.8% year-over-year increase in cycle movements in Auckland, New Zealand was 758.3% greater than their 2.4% year-over-year decrease in May 2023.
In June 2023, John Swanstrom of cyclingauthority.com said “the global bicycle market size was valued at USD 47.4 billion in 2020 and is projected to grow at a compound annual growth rate (CAGR) of 7.4% from 2021 to 2028.” That’s an average annual increase of 1.08% over each of those seven years.
When, in fact, the total value of non-motorized bicycles imported into the United States increased by 18,000% from March 2020 to February 2023, from $500,000 to $1,000,000,000, and spending on bicycles and accessories in the United States increased by 620% from March 2020 to March 2023.
I have exposed the duplicity of John Swanstrom and his website, cyclingauthority.com, by using what was known in the old days as “fact checking”.
In July 2023, cycle movements in Auckland, New Zealand increased by 16.7%, year-over-year, to 225,140.
In August 2023, cycle movements in Auckland, New Zealand increased by 14.8%, year-over-year, to 265,361.
In September 2023, cycle movements in Auckland, New Zealand increased by 6.8%, year-over-year, to 250,236.
In October 2023, cycle movements in Auckland, New Zealand increased by 7.2%, year-over-year, to 272,198.
THE ARTICLES
On March 19, 2023, bts.gov said “Notable for Bike To Work Week: National Spending on Bicycles and Accessories Grew 620% from March 2020 to March 2023; Docked Bikeshare Grew 42% percent”.
From March 2020 to March 2023, spending on bicycles and accessories in the United States increased by 620%. The uncredited Intelligence operative from bts.gov said that it was “notable”, and offered no suggestion as to why the hyper-exponential increase might have taken place.
The latter is an example of the propaganda technique known as “stonewalling”.
The article goes on to say “Increased demand for bicycles also has contributed to an increase in imports of bicycles. The total value of non-motorized bicycles imported increased just over 18,000% from 0.5 million in March 2020 to 1.0 billion in February 2023 (adjusted for inflation).”
From March 2020 to February 2023, the total value of non-motorized bicycles imported into the United States increased by 18,000%, from $500,000 to $1,000,000,000.
On June 1, 2023, cyclistsauthority.com said “Cycling Statistics 2023”. Where, despite being a cyclist for thirty years, and also despite running a website dedicated to cycling, author John Swanstrom somehow managed to avoid mentioning that cycling was increasing hyper-exponentially in 2023.
That’s an example of the propaganda technique known as “compartmentalization”.
That’s because, as a propagandist, John knows that sixty to seventy percent of readers only read the headlines, and their technique goes a long way toward “compartmentalizing” awareness of the specific magnitude of the hyper-exponential increase in cycling which he is attempting to obfuscate.
Actually, I’m being too generous. John didn’t provide any information on the hyper-exponential increase in cycling in 2023. Here’s the best he could give us: “the global bicycle market size was valued at USD 47.4 billion in 2020 and is projected to grow at a compound annual growth rate (CAGR) of 7.4% from 2021 to 2028.”
When, in fact, the total value of non-motorized bicycles imported into the United States increased by 18,000%, from $500,000 to $1,000,000,000.
I have exposed the duplicity of John Swanstrom and his website, cyclingauthority.com, by using what was known in the old days as “fact checking”.
Here’s John Swanstrom’s picture, in a Satanic purple cycling jersey:
(John Swanstrom)
I have included his picture so that you could get a better idea of what a generational Satanist Freemason in a position of marginal influence looks like.
They are all related to one another through the maternal bloodline. They comprise roughly twenty percent of the populace, and are hiding in plain sight in every city, town and village on Earth.
It’s how the few have controlled the many all the way back to Babylon, and before.
But they say that the hardest part of solving a problem is recognizing that you have one.
Don Croft used to say “Parasites fear exposure above all else”.
A current article from Auckland, New Zealand on at.govt.nz is headlined “Monthly cycle monitoring”.
Where, under the false guise of familiarity, the uncredited Intelligence operative from the New Zealand government omitted any mention of New Zealand, Aukland, or the time periods under discussion, to make the subject virtually unsearchable.
Those are all examples of the propaganda technique known as “compartmentalization”.
Jeff Miller, Honolulu, HI, December 15, 2023
If you’d like to be added to this free mailing list, please send me a note at [email protected]