“Just because we don’t understand doesn’t mean that the explanation doesn’t exist.”
― From “A Wrinkle in Time”, by Madeleine L’Engle, 1962
“How often have I said to you that when you have eliminated the impossible, whatever remains, however improbable, must be the truth?”
Sherlock Holmes, from “The Sign of the Four”, by Sir Arthur Conan Doyle, 1890
Both the prevalence of drinking and the volume of alcohol consumed by those who still did drink began to decrease hyper-exponentially in 2022.
Does this not also infer the imminence of the populace throwing off tyranny?
THE DATA
From 1980 to 2017, per capita alcohol consumption in the United States decreased by an annual average of .4%.
From 1980 to 2017, per capita alcohol consumption in the United States decreased by 15.5%, from 10.3 liters, or 2.72 gallons to 8.7 liters, or 2.3 gallons.


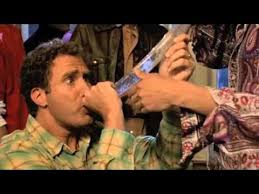
(Will Ferrell as Frank “the Tank” Ricard, doing a beer bong, from the movie “Old School”, 2003)
From 2009 to 2024, the prevalence of past-year drinking among adults in the United States decreased by an annual average of 1.2%.
From 2009 to 2024, the prevalence of past-year drinking among adults in the United States decreased by 17.7%, from 70.5% to 58%.
From 2009 to 2011, the prevalence of past-year drinking among adults in the United States was 70.5%.
From 2021 to 2022, per capita alcohol consumption in the United States deceased by .4%, form 2.51 gallons to 2.5 gallons.
From 2021 to 2022, the .4% decrease in per capita alcohol consumption in the United States was identical to its .4% long-term average annual decrease from 1980 to 2017.
In 2021, per capita alcohol consumption in the United States totaled 2.51 gallons.
In 2022, per capita alcohol consumption in the United States was 9.5 liters, or 2.5 gallons.
From 2022 to 2024, per capita alcohol consumption in the United States decreased by an annual average of 4%.
From 2022 to 2024, per capita alcohol consumption in the United States decreased by 8%, from 9.5 liters, or 2.5 gallons to 8.7 liters, or 2.3 gallons.
From 2022 to 2024, the percentage of Americans who drank alcohol decreased by 10.7%, from 65% to 58%.
From 2022 to 2024, the 4% average annual decrease in per capita alcohol consumption in the United States was 900% greater, or ten times greater than its long-term average annual decrease of .4% from 1980 to 2017, and also its .4% decrease from 2021 to 2022.
The great positive societal change is increasing, going forward in time.
That is because the health of the ether is inexorably improving, and moral and mental health vary directly with that of the subject’s etheric environment.
From 2022 to 2023, the prevalence of past-year drinking among adults in the United States decreased by 4.6%, from 65% to 62%.
In 2022, 65% of Americans reported drinking alcohol.
From 2023 to 2024, the prevalence of past-year drinking among adults in the United States decreased by 6.5%, from 62% to 58%.
From 2023 to 2024, the 6.5% decrease in the prevalence of past-year drinking among adults in the United States was 41.3% greater than its 4.6% decrease from 2022 to 2023.
In 2023, 62% of Americans reported drinking alcohol.
From 2023 to 2024, the 6.5% decrease in the prevalence of past-year drinking among adults in the United States was 441.6% greater, or well more than five times greater than its 1.2% long-term average annual decrease from 2009 to 2024.
The great positive societal change is increasing, going forward in time.
That is because the health of the ether is inexorably improving, and moral and mental health vary directly with that of the subject’s etheric environment.
In 2024, per capita alcohol consumption in the United States was 8.7 liters, or 2.3 gallons.
In 2024, 58% of Americans reported drinking alcohol.
Jeff Miller, Honolulu, HI, October 4, 2024
If you’d like to be added to this free mailing list, or know someone who would be, please send me a note at [email protected].