“We balance probabilities and choose the most likely. It is the scientific use of the imagination.”
Sherlock Holmes, from “The Hound of the Baskervilles”, by Sir Arthur Conan Doyle, 1901
On April 1, 1845, the US Post Office Department inaugurated the first commercial telegraph service.
From 1860 to 1890, the rate of imprisonment in the United States increased by 116.6%, or by more than two times, from 607 per million to 1,315 per million.
Given that moral and mental health vary directly with the health of the ether, this sudden, exponential, historically-unpredented increase in crime was driven by the poisoning of the ether by technologies that include electrical grids, the telegraph and the telephone, along with a steady increase in death energy in the environment provided by ever-expanding graveyards.
From 1860 to 1870, the rate of imprisonment in the United States increased by 40.5%, from 607 per million to 853 per million.
In 1860, per Charles A. Ellwood in the Journal of Criminal Law and Criminology in 1910, the rate of imprisonment in the United States was 607 per million.
From 1870 to 1880, the rate of imprisonment in the United States increased by 37.0%, from 853 per million to 1,169 per million.
From 1870 to 1880, the 37% increase in the rate of imprisonment in the United States was 24.1% less, or almost one fourth less than its 40.5% increase from 1860 to 1870.
The rate of the increase in crime in the United States decreased by almost one fourth from 1870 to 1880, despite rapid increases in population.
Here we see that the exponential, technology-driven increase in crime in the United States from 1860 to 1890 takes place within the larger context of an environment whose health was improving inexorably up to and beyond the end of the Mayan “long count” in 2012.
In 1870, per Charles A. Ellwood in the Journal of Criminal Law and Criminology in 1910, the rate of imprisonment in the United States was 853 per million.
In 1877, the first commercial telephone service began in the United States.
The 1880’s saw long-distance telephone service grow via metallic circuits.
From 1880 to 1890, the rate of imprisonment in the United States increased by 12.4%, from 1,169 per million to 1,315 per million.
From 1880 to 1890, 12.4% increase in the rate of imprisonment in the United States was 66.4% less, or two thirds less than its 37% increase from 1870 to 1880.
From 1880 to 1890 versus 1870 to 1880, the 66.4% negative variance in the increase in the rate of imprisonment in the United States was 175.5% greater, or almost four times greater than its 24.1% negative variance from 1870 to 1880 versus 1860 to 1870
Given that moral and mental health vary directly with the health of the ether, then here we see the health of the ether improving exponentially from 1860 to 1890.
Here we see that the exponential, technology-driven increase in crime in the United States from 1860 to 1890 takes place within the larger context of an environment whose health was improving inexorably up to and beyond the end of the Mayan “long count” in 2012.
1880 to 1890, the number of prisoners in state prisons and penitentiaries in the United States increased by an annual average of 4.75%.
From 1880 to 1890, per Charles A. Ellwood in the Journal of Criminal Law and Criminology in 1910, the population of the United States increased by 24%.
From 1880 to 1890, the number of prisoners in state prisons and penitentiaries in the United States increased by an annual average of 4.75%.
From 1880 to 1890, the number of prisoners in state prisons and penitentiaries in the United States increased by 47.5%, or by almost half, or by 14,574 prisoners, from 30,659 to 45,233.
From 1880 to 1890, the 47.5% increase in the number of prisoners in state prisons and penitentiaries in the United States was 97.9% greater, or basically two times greater than the 24% increase in the population of the United States during the same time period.
That is an example of the propaganda technique known as “stonewalling”.
In 1880, per Charles A. Ellwood in the Journal of Criminal Law and Criminology in 1910, “the census showed the number of prisoners in state prisons and penitentiaries to be 30,659”.
In 1880, per Charles A. Ellwood in the Journal of Criminal Law and Criminology in 1910, the rate of imprisonment in the United States was 1,169 per million.
In 1882 Thomas Edison constructed Pearl Street Station, the first purpose-built power station. Built in New York City, this station provided the first electric light to Wall Street financiers and the New York Times.
From 1890 to 1904, the number of prisoners in state prisons and penitentiaries in the United States increased by an annual average of 7%.
From 1890 to 1904, the 7% average annual increase in the number of prisoners in state prisons and penitentiaries in the United States was 47.4% greater, or almost half again greater than its 4.75% average annual increase from 1880 to 1890.
In his study in the Journal of Law and Criminology in 2010, author Charles A. Ellwood omitted this statistic.
That is an example of the propaganda technique known as “stonewalling”.
From 1890 to 1904, the number of prisoners in state prisons and penitentiaries in the United States increased by 97.5%, or by basically two times, or by 29,894 prisoners, from 30,659 to 60,553.
Let that sink in for a moment. The prison population in the United States basically doubled in just fourteen years.
From 1890 to 1895, the population of the United States increased by an annual average of 2%.
From 1890 to 1895, the number of prisoners in state prisons and penitentiaries in the United States increased by an annual average of 4%.
From 1890 to 1895, the 4% average annual increase in the number of prisoners in state prisons and penitentiaries in the United States was 100% greater, or two times greater than the 2% average annual increase in the population of the United States during the same time period.
Here we see a plague of technology-driven crime. Moral and mental health vary directly with the health of the ether.
From 1890 to 1895, per Charles A. Ellwood in the Journal of Criminal Law and Criminology in 1910, “the population, we note, could not have increased much more than ten per cent”.
From 1890 to 1895, the 4% average annual increase in the number of prisoners in state prisons and penitentiaries in the United States was 15.8% less than its 4.75% average annual increase from 1880 to 1890.
Here, from 1890 to 1895, despite the plague of technology-driven crime, the health of the ether is still ultimately improving at a rate greater than the nascent technology of the day’s ability to degrade it.
From 1890 to 1895, the number of prisoners in state prisons and penitentiaries in the United States increased by 19.9%, or by basically one fifth, or by 9,011 prisoners, from 45,233 to 54,244.
In 1890, there was a system whereby news, music, live theatre, music hall, fiction readings, religious broadcasts, etc., were available in private homes [and other places] via the conventional telephone line, with subscribers being supplied with a number of special, personalised headsets.
In Britain this system was known as Electrophone; in Hungary, it was called Telefon Hírmondó; and in France, Théâtrophone.
In 1890, per Charles A. Ellwood in the Journal of Criminal Law and Criminology in 1910, the number of prisoners in state prisons and penitentiaries in the United States was 45,233.
In 1890, per Charles A. Ellwood in the Journal of Criminal Law and Criminology in 1910, the rate of imprisonment in the United States was 1,315 per million.
From 1895 to 1904, the number of prisoners in state prisons and penitentiaries in the United States increased by an annual average of 1.3%.
From 1895 to 1904, the number of prisoners in state prisons and penitentiaries in the United States increased by 11.6%, or by 6,309 prisoners, from 54,244 to 60,553.
From 1895 to 1904, the 1.3% average annual increase in the number of prisoners in state prisons and penitentiaries in the United States was 67.5% less, or more than two thirds less than its 4% average annual increase from 1890 to 1895.
From 1895 to 1904, the 67.5% negative variance in the increase in the number of prisoners in state prisons and penitentiaries in the United States versus 1890 to 1895 was 327.2% greater, or more than four times greater than its 15.8% negative variance from 1890 to 1895 versus 1880 to 1890.
Given that moral and mental health vary directly with the health of the ether, this statistic documents that, from 1880 to 1904, the underlying health of the ether was improving exponentially at a rate exponentially greater than the ability of the nascent technologies of the day to degrade it.
In 1895, Guglielmo Marconi made the first radio transmission from a temporary station set up on the Isle of Wight in England.
In 1895, per Charles A. Ellwood in the Journal of Criminal Law and Criminology in 1910, the number of prisoners in state prisons and penitentiaries in the United States was 54,244.
The image immediately below is a chart of homicide rates in the United States from 1900 to 1973.
It’s from a study entitled “Homicide Trends in the United States, 1900-1974”, written by A. Joan Klebba, M.A. in 1974.
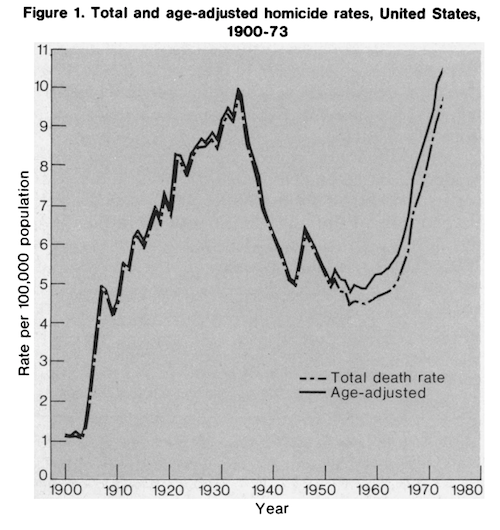
(The homicide rates in the United States from 1900 to 1973)
From 1900 to 1903, the the homicide rate in the United States remained unchanged, at 1.2 per 100,000, the lowest since recordkeeping began.
In 1900, the homicide rate in the United States was 1.2 per 100,000, the lowest since recordkeeping began.
From 1903 to 1933, the homicide rate in the United States increased by an annual average of 7%.
From 1903 to 1933, the homicide rate in the United States increased by 708.3%, or by more than eight times, from an all-time low 1.2 per 100,000 to an all-time high 9.7 per 100,000.
What could have caused this sudden, hyper-exponential increase in homicide?
It is certainly not a societal or cultural lever, such as “violence in the media”.
While there was an hyper-exponential increase in crime in the United States from 1860 to 1890, the lack of an increase in homicide from 1900 to 1903 shows that electrical grids, the telephone and the telegraph did not move the needle like the transmission of radio waves through the air, through the ether did going forward into the 20th Century.
In 1903, the homicide rate in the United States was 1.2 per 100,000, tied with 1900 as the lowest since recordkeeping began.
In 1904, per Charles A. Ellwood in the Journal of Criminal Law and Criminology in 1910, the number of prisoners in state prisons and penitentiaries was 60,553.
In 1905-06, radio broadcasting of music and talk intended to reach a dispersed audience started experimentally.
In 1910, the Journal of Criminal Law and Criminology published a study by Charles A. Ellwood which questioned “Has Crime Increased in the United States Since 1880”.
When, in fact, from 1890 to 1904, the number of prisoners in state prisons and penitentiaries in the United States increased by 97.5%, or by basically two times, or by 29,894 prisoners, from 30,659 to 60,553, at a rate 100% greater, or two times greater than the 2% average annual increase in the population of the United States during the same time period.
I generated those percentage increases from Mr. Ellwood’s own study, while Mr. Ellwood took care to omit both of them.
As you can see, Charles A. Ellwood and the Journal of Criminal Law and Criminology are using an example of the propaganda technique known as “the Big Lie”.
I have exposed their duplicity by using what was known in the old days as “fact checking”.
Here’s a picture of Charles A. Ellwood.

(Charles A. Ellwood)
I have included his picture so that you could get a better idea of what a generational Satanist Freemason of marginal influence looks like.
They are all related to one another through the maternal bloodline.
Generational Satanists comprise between twenty and thirty percent of the populace, and are hiding in plain sight in every city, town and village on Earth.
It’s how the few have controlled the many all the way back to Babylon, and before.
But they say that the hardest part of solving a problem is recognizing that you have one.
Don Croft used to say “Parasites fear exposure above all else”.
How long do you think that these people have left in power, now?
Please consider doing what you can to help speed the transition.
From 1933 to 1950, the homicide rate in the United States decreased by 47.4%, or by almost half, from an all-time high 9.7 per 100,000 to 5.1 per 100,000, the latter being roughly the level at which it was in 1909.
What could have possibly caused this exponential decrease in homicide?
It was certainly not “improved family values”, nor “moral education via radio shows such as ‘Little Orphan Annie’.”
This statistic demonstrates that the health of the ether was improving inexorably up to and beyond the end of the Mayan “long count” in 2012, despite the best efforts of technology to stop or slow it.
In 1933, the homicide rate in the United States was an all-time high 9.7 per 100,000.
The following FBI crime data explorer chart documents the murder rate in the United States from 1950 to 2024.
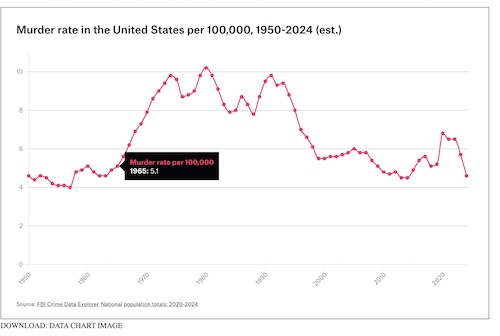
(FBI crime data explorer chart documents the murder rate in the United States from 1950 to 2024)
From 1950 to 1973, the homicide rate in the United States increased by 121.7%, or by more than two times, from 4.6 per 100,000 to an all-time high 10.2 per 100,000.
Here, while purporting to be a scientist by trade, the University of Michgan’s A. Joan Klebba, MA omitted the percentage increase from her study, and explained that it was because of “increases in population between 1960 and 1972 for the age groups 15-19, 20-24, and 25-29.”
Where the general “increases in population” is an example of the propaganda technique known as “plausible deniability” or “the Big Lie”.
Joan is desperate to keep you from recognizing that moral and mental health vary directly with the health of the ether.
From 1950 to 1960, the homicide rate in the United States increased by an annual average of 1.0%.
From 1950 to 1960, the homicide rate in the United States increased by 10.8%, from 4.6 per 100,000 to 5.1 per 100,000.
In 1950, the homicide rate in the United States was 4.6 per 100,000.
Here, after peaking in 1933, the homicide rate in the United states has returned to roughly the level at which it was in 1907.
The health of the underlying environment is improving at a rate greater than technology’s ability to degrade it.
From 1960 to 1973, the homicide rate in the United States increased by an annual average of 7%.
From 1960 to 1973, the 7% average annual increase in the homicide rate in the United States was 600% greater, or seven times greater than its 1% average annual increase from 1950 to 1960.
This hyper-exponential increase in the homicide rate from 1960 to 1973 is the result of the poisoning of the ether by the low-wavelength microwave radiation from what we collectively refer to as “technology”.
From 1960 to 1973, the 7% average annual increase in the homicide rate in the United States and its 7% average annual increase from 1903 to 1933 were identical.
From 1960 to 1973, the homicide rate in the United States increased by 92.2%, or almost two times, from 5.1 per 100,000 to an all-time high 9.8 per 100,00.
In 1960, the homicide rate in the United States was 5.1 per 100,000.
Here, after peaking in 1933, the homicide rate in the United state has returned to roughly the level at which it was in 1910.
In 1971, the film “Dirty Harry” premiered in San Francisco, California.

(Clint Eastwood as “Dirty Harry”, 1971)
From 1973 to 1980, the homicide rate in the United States increased by an annual average of .6%,
From 1973 to 1980, the homicide rate in the United States increased by 4%, from an all-time high 9.8 per 100,000 to an all-time high 10.2 per 100,000.
From 1973 to 1980, the .6% average annual increase in the homicide rate in the United States was 91.4% less, or almost two times less than its 7% average annual increase from 1960 to 1973.
This statistic demonstrates that the health of the ether was improving inexorably up to and beyond the end of the Mayan “long count” in 2012, despite the best efforts of technology to stop or slow it.
In 1973, the homicide rate in the United States was an all-time high 9.8 per 100,000.
In 1973, there were 20,465 homicides in the United States.
In 1980, the homicide rate in the United States was an all-time high 10.2 per 100,000.
From 1980 to 1991, the homicide rate in the United States decreased by an annual average of .4%.
From 1980 to 1991, the homicide rate in the United States decreased by 3.9% from an all-time high 10.2 per 100,000 to 9.8 per 100,000.
This after homicides increased continuously and exponentially from 1950 to 1980.
This statistic demonstrates that the health of the ether was improving inexorably up to and beyond the end of the Mayan “long count” in 2012, despite the best efforts of technology to stop or slow it.
The following chart is of mass shootings in the United States from 1982 to 2025, per statista.com.
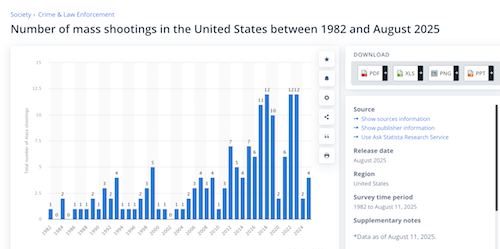
(Mass shootings in the United States from 1982 to 2025, per statista.com)
From 1982 to 2018, mass shootings in the United States increased by an annual average of 30.6%.
From 1982 to 2018, mass shootings in the United States increased by 1,100%, or by twelve times, from an all-time low 1 mass shooting to an all-time high 12 mass shootings.
From 1982 to 2000, mass shootings in the United States remained unchanged, at 1 per year.
From 1982 to 1999, mass shootings in the United States increased by an annual average of 23.5%.
From 1982 to 1999, mass shootings in the United States increased by 400%, from 1 to 5.
From 1982 to 1991, mass shootings in the United States increased by an annual average of 22.2%.
From 1982 to 1991, mass shootings in the United States increased by 200%, or by three times, from an all-time low 1 mass shooting to 3 mass shootings.
In 1982, per statista.com, there was an all-time low one mass shooting in the United States.
From 1991 to 2024, mass shootings in the United States decreased by an annual average of 1%.
From 1991 to 2024, mass shootings in the United States decreased by 33.3%, or by one third, from 3 to 2.From 1991 to 1993, mass shootings in the United States increased by 33.3%, from three to four.
From 1991 to 1999, the 23.5% average annual increase in mass shootings in the United States was 5.9% greater than their 22.2% average annual increase from 1982 to 1991.
From 1991 to 2018, the 30.6% average annual increase in mass shootings in the United States was 37.8% greater, or more than one third greater than their 22.2% average annual increase from 1982 to 1991.
From 1991 to 1993, the 33.3% increase in mass shootings in the United States was 8.8% greater than their 30.6% average annual increase from 1982 to 1991.
Here, from 1991 to 1993, mass shootings in the United States are increasing exponentially thanks to the poisoning of the ether by the low-wavelength microwave radiation from what we collectively refer to as “technology”.
In 1991, per statista.com, there were three mass shootings in the United States.
In 1991, per fbi.gov, the homicide rate in the United States was 9.8 per 100,000.
Here, in 1991, after peaking in 1980, the homicide rate has decreased back to the rate of 1974.
From 1993 to 1999, mass shootings in the United States increased by an annual average of 4.2%.
From 1993 to 1999, mass shootings in the United States increased by 25%, from four to five.
From 1993 to 1999, the 4.2% average annual increase in mass shootings in the United States was 87.7% less, or more than three fourths less than their 33.3% average annual increase from 1991 to 1993.
Here, from 1993 to 1999, with the end of the Mayan “long count” in 2012 hoving into view, the health of the ether is improving at a rate exponentially greater than that of technology to degrade it.
It was for this reason that what we collectively refer to as “wireless technology” was developed and deployed in the late 1990’s, along with the psychotic “chemtrail” operations which have since been largely abandoned.

(Cell towers)

(Chemtrails)
In 1993, per statista.com, there were four mass shootings in the United States.
From 1999 to 2025, mass shootings in the United States decreased by an annual average of .8%.
From 1999 to 2025, mass shootings in the United States decreased by 20%, from 5 to 4.
From 1999 to 2018, the 37.8% positive variance in the increase in mass shootings in the United States versus 1982 to 1991 was 540.6% greater, or almost six and a half times greater than its 5.9% variance from 1991 to 1999 versus 1982 to 1991.
Here, from 1991 to 2018, mass shootings in the United States are increasing exponentially thanks to the poisoning of the ether by the low-wavelength microwave radiation from what we collectively refer to as “technology”.
Moral and mental health vary directly with the health of the ether.
From 1999 to 2025, mass shootings in the United States decreased by an annual average of .8%.
From 1999 to 2025, mass shootings in the United States decreased by 20%, from 5 to 4.
From 1999 to 2018, mass shootings in the United States increased by an annual average of 7.4%.
From 1999 to 2018, the 7.4% average annual increase in mass shootings in the United States was 68.5% less, or two thirds less than their 23.5% average annual increase from 1982 to 1999.
If my theory that moral and mental health varies directly with the health of the ether is correct, then here we see the ether inexorably improving, going forward in time, even despite the best efforts of technology to slow or stop it.
From 1999 to 2018, mass shootings in the United States increased by 140%, from five to an all-time high 12.
From 1999 to 2013, the homicide rate in the United States decreased by an annual average of 1.3%.
From 1999 to 2013, the homicide rate in the United States decreased by 18.1%, from 5.5 per 100,000 to 4.5 per 100,000.
From 1999 to 2013, the health of the ether improved to the point were it was respectively in 1966 and 1958, and in 1912 and 1905.
From 1999 to 2012, mass shootings in the United States increased by an annual average of 3%.
From 1999 to 2012, the 3% average annual increase in mass shootings in the United States was 28.5% less, or almost one third less than their 4.2% average annual increase from 1993 to 1999.
Here, from 1999 to 2012, with the latter represting the end of the Mayan “long count”, the health of the ether is still improving at a rate greater than that of technology’s ability to degrade it.
From 1999 to 2012, mass shootings in the United States increased by 40%, or by almost one half, from five to seven.
In 1999, per statista.com, there were 5 mass shootings in the United States.
In 1999, per fbi.gov the homicide rate in the United States was 5.5 per 100,000.
This is just below the rate of 5.6 per 100,000 documented in 1966, and prior to that in 1912.
In 2000, per statista.com, there was one mass shooting in the United States.
From 2012 to 2018, the 7.4% average annual increase in mass shootings in the United States was 146.6% greater, or almost one and a half times greater than their 3% average annual increase from 1999 to 2012.
Here, from 2012 to 2018, wireless technology is degrading the health of the ether at a rate exponentially greater than that at which is improving.
From 2012 to 2015, mass shootings in the United States remained unchanged at seven per year.
In 2012, per statista.com, there were seven mass shootings in the United States.
From 2013 to 2025, the homicide rate in the United States decreased by an annual average of 3.9%.
From 2013 to 2025, the homicide rate in the United States decreased by 46.6%, or by almost half, from 4.5 per 100,000 to 2.4 per 100,000.
From 2013 to 2025, the 3.9% average annual decrease in the homicide rate in the United States was 200% greater, or three times greater than its 1.3% average annual derease from 1999 to 2013.
Given that moral and mental health vary directly with the health of the ether, the homicide rate in the United States is decreasing exponentially because the health of the ether is inexorably improving, despite the best efforts of technology to slow or stop it.
In 2013, per fbi.gov, the homicide rate in the United States was 4.5 per 100,000.
This is just below the rate of 4.8 per 100,000 documented in 1958, and prior to that in 1905.
From 2015 to 2017, mass shootings in the United States increased by an annual average of 28.6%.
From 2015 to 2017, mass shootings in the United States increased by 57.1%, from seven to eleven.
From 2015 to 2017, the 28.6% average annual increase in mass shootings in the United States was 853.3% greater, or more than nine and a half times greater than their 3% average annual increase from 1999 to 2012.
This sudden, exponential increase in mass shootings from 2015 to 2017 documents the degradation of the health of the ether by wireless technology.
In 2015, per statista.com, there were seven mass shootings in the United States.
In 2017, per statista.com, there were eleven mass shootings in the United States.
From 2018 to 2023, mass shootings in the United States remained unchanged, at an all-time high twelve.
In 2018, per statista.com, there were an all-time high twelve mass shootings in the United States.
From 2019 to 2020, mass killings in the United States decreased by 2.4%, from an all-time high 41 to 40.
In 2022, per statista.com, there were an all-time high twelve mass shootings in the United States, tying the record of 12 set in 2018.
In 2022, per cdc.gov, there were 17,927 firearm homicides in the United States.
In 2022, per cdc.gov, there were 22,830 homicides in the United States.
In 2022, per cdc.gov, the homicide rate in the United States was 6.8 per 100,000.
From 2022 to 2023, per the Real-Time Crime Index, which compiles data from 570 law enforcement agencies, homicides in the United States decreased by 6%.
From 2022 to 2023, the homicide rate in the United States decreased by 13.3%, from 6.8% to 5.9%.
In 2023, per statista.com, there were an all-time high twelve mass shootings in the United States, tying the total of 12 in 2022 and 2018.
In 2023, per bjs.ojp.gov, the homicide rate in the United States was 5.9 per 100,000.
This is just above the 5.8 per 100,000 in 2006 and 2007, and just below the rate of 6.2 per 100,000 in 1967. It is identical to the rate of 5.9 per 100,000 documented in 1940 and 1910.
From 2023 to 2025, mass shootings in the United States decreased by an annual average of 33.4%.
From 2023 to 2025, mass shootings in the United States decreased by 66.7%, or by two thirds, from twelve to four.
From 2023 to 2025, the 33.4% average annual decrease in mass shootings in the United States was 216.7% greater, or more than three times greater than their 2015 to 2017, the 28.6% average annual increase from 2015 to 2017.
From 2023 to 2025, the 33.4% average annual decrease in mass shootings in the United States was 4,075% greater, or more than twenty eight times greater than their .8% average annual decrease from 1999 to 2025.
Despite hysterical propaganda to the contrary, mass killings in the United States are decreasing hyper-exponentially, because the health of the ether is inexorably improving, and moral and mental health vary directly with the health of the ether.
From 2023 to 2024, per the Real-Time Crime Index, which compiles data from 570 law enforcement agencies, homicides in the United States decreased by 13%.
From 2023 to 2024, the homicide rate in the United States decreased by 15.3%, from 5.9 per 100,000 to 5 per 100,000.
From 2023 to 2024, mass shootings in the United States decreased by 83.3%, or by more than three fourths, from an all-time high twelve to two.
From 2023 to 2024, the 15.3% decrease in the homicide rate in the United States was 155% greater, or one and a half times greater than its 6% decrease from 2022 to 2023.
From 2023 to 2024, the 83.3% decrease in mass shootings in the United States was 8,200% greater, or more than 83 times greater than their 1% average annual decrease from 1991 to 2024.
Given that moral and mental health vary directly with the health of the ether, the homicide rate in the United States is decreasing exponentially because the health of the ether is inexorably improving, despite the best efforts of technology to slow or stop it.
In 2024, per statista.com, there were two mass shootings in the United States, matching the total from 2020, 2005, 1992, 1989 and 1984.
In 2024, per fbi.gov, the homicide rate in the United States was 5 per 100,000.
From 2024 to 2025, per the Real-Time Crime Index, which compiles data from 570 law enforcement agencies, homicides in the United States decreased by 15%.
Please note that the Real-Time Crime Index did not provide any statistics to back up their assertion.
From 2024 to 2025, the homicide rate in the United States decreased by 45.8%, or by almost half, from 5 per 100,000 to 2.71 per 100,000.
From 2024 to 2025, the unsubstantiated 15% decrease in homicides in the United States claimed by the Real-Time Crime Index, which compiles data from 570 law enforcement agencies was 69% less, or more than two thirds less than the 48.5% decrease in the homicide rate in the United States per fbi.gov.
The Real-Time Crime Index’s claim that homicides in the United States decreased by 15% is brazenly false.
As you can see, they’re using an example of the propaganda technique known as “the Big Lie”.
I have exposed their duplicity by using what was known in the old days as “fact checking”.
From 2024 to 2025, the 239.9% positive variance in the decrease in the homicide rate in the United States versus 2023 to 2024 was 54.8% greater, or more than half again greater than its 155% positive variance from 2023 to 2024 versus 2022 to 2023.
From 2024 to 2025, the 52% decrease in the homicide rate in the United States was 239.9% greater, or almost three and a half times greater than its 15.3% decrease from 2023 to 2024.
Given that moral and mental health vary directly with the health of the ether, the homicide rate in the United States is decreasing exponentially because the health of the ether is inexorably improving, despite the best efforts of technology to slow or stop it.
From January 2024 to October 2024, there were 7,369 murders in the United States.
In 2025, per statista.com, there were four mass shootings in the United States, matching the total from 2014, 2009, 2007 and 1993.
In 2025, per consumershield.com, the homicide rate in the United States was 2.71 per 100,000, the lowest in history.
This is a rate documented only one time previously, in 1904.
On December 2, 2025, northeastern.edu’s James Alan Fox said “U.S. mass killings are down in 2025, though experts say it’s likely a return to typical levels”.
When, in fact, from 2023 to 2025, the 33.4% average annual decrease in mass shootings in the United States was 4,075% greater, or more than twenty eight times greater than their .8% average annual decrease from 1999 to 2025.
As you can see, James is using an example of the propaganda technique known as “the Big Lie”.
I have exposed his duplicity, along with that of his employer, Northeastern University, by using what was known in the old days as “fact checking”.
Per Northeastern University, “James Alan Fox has published 18 books, dozens of journal and magazine articles, and hundreds of freelance columns in newspapers around the country.”
Here’s a picture of Northeastern University’s James Alan Fox, where the image is constructed to focus attention on his left eye, and where he’s using his left hand to make a purportedly-secret Masonic “gesture of recognition”.

(Northeastern University’s James Alan Fox)
Now here’s a 19th Century depiction of a Freemason using the same purportedly-secret “gesture of recognition” that Northeastern University’s James Alan Fox is in the photo immediately above.

(19th Century depiction of a Freemason using a purportedly-secret “gesture of recognition”.)
For any Coincidence theorists lingering in the readership, here’s a second image of Mr. Fox, in a Satanic-purple tie, where the image is constructed to focus attention on his left eye, where he’s widening his eyes to simulate honesty, and where using the same purportedly-secret Masonic “gesture of recognition” that we’ve reviewed in the two images immediately above.

(Northeastern University’s James Alan Fox)
To maintain current programming levels, stop reading immediately and affirm “oh, some people just like to talk with their hands.”
The image features his left eye because, to bloodline-linked Illuminists like Northeastern University’s James Alan Fox, the left eye is the “eye of Will” or the “eye of Horus”.
‘The right eye is the Eye of Ra and the left is the Eye of Horus’.”
From “Freemasonry - Religion And Belief - The 3rd Temple”
Facebook: “Welcome to the Left-Hand-Path-Network, where Satanism is not about worship, but it’s study.”
I have included James Alan Fox’s picture so that you could get a better idea of what a generational Satanist Freemason of marginal influence looks like.
They are all related to one another through the maternal bloodline.
Generational Satanists comprise between twenty and thirty percent of the populace, and are hiding in plain sight in every city, town and village on Earth.
It’s how the few have controlled the many all the way back to Babylon, and before.
But they say that the hardest part of solving a problem is recognizing that you have one.
Don Croft used to say “Parasites fear exposure above all else”.
How long do you think that these people have left in power, now?
Please consider doing what you can to help speed the transition.
Jeff Miller, Honolulu, HI, January 14, 2026
If you’d like to be added to this free mailing list, or know someone who would be, please send me a note at [email protected].