A Study of Suicide in Japan from 1881 to 2025 Proving Low Wavelength Microwave Radiation as Driver of Suicide and Schizophrenia
by Jeff Miller, Honolulu, HI, February 18, 2026
“If someone is able to show me that what I think or do is not right, I will happily change, for I seek the truth, by which no one was ever truly harmed. It is the person who continues in his self-deception and ignorance who is harmed.”
― From “Meditations”, by Marcus Aurelius, 161 to 180 A.D.
This new suicide data will now be integrated into the Master document, “Homicide, Suicide and Autism As Manifestations of Technology-Driven Schizophrenia, Otherwise Known as Demonic Possession”.
I haven’t yet published that document here on the U.K. Orgones Forum; it’s too large. For now only my subscribers have copies.
If I get time I’ll chop it down and post a copy here.
From 1881 to 2025, the suicide rate in Japan decreased by an annual average of .02%.
From 1881 to 2025, the suicide rate in Japan decreased by 3.2%, from 15.8 per 100,000 to 15.3 per 100,000.
From 1881 to 1943, the suicide rate in Japan decreased by an annual average of .17%.
From 1881 to 1943, the suicide rate in Japan decreased by 10.8%, from 15.8 per 100,000 to 14.1 per 100,000.
In “Long-Term Impact of World War II on Suicide in Japan”, by Tadashi Takeshima, Director, Kawasaki City Inclusive Rehabilitation Center and Chairman, Japan Liaison Committee for Mental Health, published by the New England Journal of Public Policy in November 2024, Tadashi said “even before World War II, Japan was a country with high suicide rates for both men and women.”
From 1890 to 2025, the suicide rate in Japan decreased by an annual average of .0234%.
From 1890 to 2025, the suicide rate in Japan decreased by 3.16%, from 15.8 per 100,000 to 15.3 per 100,000.
From 1881 to 1890, the suicide rate in Japan remained unchanged, at 15.8 per 100,000.
From 1881 to 1890, the suicide rate in Japan was 15.8 per 100,000.
From 1881 to 1890, per Tadashi Takeshima, the suicide rate in Japan was 15.8 per 100,000.
The following image documents the suicide rate from 1900 to 2019 in Japan per 100,000 people per year.
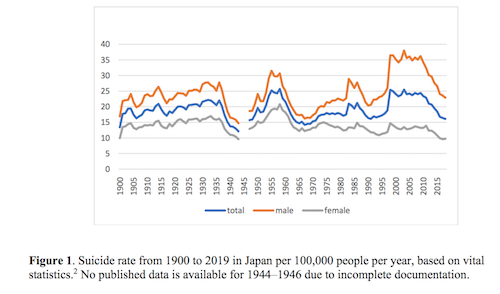
(Suicide rate from 1900 to 2019 in Japan per 100,000 people per year)
I got the chart from “Long-Term Impact of World War II on Suicide in Japan”, by Tadashi Takeshima, Director, Kawasaki City Inclusive Rehabilitation Center and Chairman, Japan Liaison Committee for Mental Health, published by the New England Journal of Public Policy in November 2024.
From 1881 to 1890 the ratio of male to female suicides in Japan was 100:57.6.
From 1890 to 1900, the suicide rate in Japan decreased by an annual average of 3.7%.
From 1890 to 1900, the 3.7% average annual decrease in the suicide rate in Japan was infinitely greater than its stasis from 1881 to 1890.
Given that moral and mental health vary directly with the health of the ether, this hyper-exponential decrease in the suicide rate in Japan from 1890 to 1900 documents the fact that the health of the ether in Japan was improving exponentially from 1881 to 1900.
In “Long-Term Impact of World War II on Suicide in Japan”, by Tadashi Takeshima, Director, Kawasaki City Inclusive Rehabilitation Center and Chairman, Japan Liaison Committee for Mental Health, published by the New England Journal of Public Policy in November 2024, Tadashi said “even before World War II, Japan was a country with high suicide rates for both men and women.”
It’s sleight-of-hand, a distraction to keep you from recognizing that suicide in Japan was decreasing hyper-exponentially from 1881 to 1900.
I have exposed the duplicity of Tadashi Takeshima by using what was known in the old days as “fact checking”.
From 1890 to 1900, the suicide rate in Japan decreased by 36.7%, or by more than one third, from 15.8 per 100,000 to 10 per 100,000.
From 1900 to 2024, the suicide rate in Japan increased by an annual average of .21%.
From 1900 to 2024, the suicide rate in Japan increased by 26.1%, from 13 per 100,000 to 16.4 per 100,000.
From 1900 to 2018, the suicide rate in Japan increased by an annual average of .25%.
From 1900 to 2018, the suicide rate in Japan increased by 29.8%, or by almost one third, from 13 per 100,000 to 16.87 per 100,000.
From 1900 to 2012, the suicide rate in Japan increased by an annual average of .6%.
From 1900 to 2012, the suicide rate in Japan increased by 67.6%, from 13 per 100,000 to 21.8 per 100,000.
From 1900 to 2000, the suicide rate among males in Japan increased by 117.6%, or by more than two times, from 17 per 100,000, or .017%, to 37 per 100,000, or .037%.
From 1900 to 2000, the suicide rate among males in Japan increased by an annual average of 1.2%.
From 1900 to 2000, the suicide rate among females in Japan increased by 40%, from 10 per 100,000, or .010%, to 14 per 100,000, or .014%.
From 1900 to 2000, the suicide rate among females in Japan increased by an annual average of .4%.
From 1900 to 2000, the 1.2% average annual increase in the suicide rate among males in Japan was 200% greater, or three times greater than the .4% average annual increase among their female peers.
From 1900 to 1995, the suicide rate in Japan increased by an annual average of .33%.
From 1900 to 1995, the suicide rate in Japan by 31.5%, or by almost one third, from 13 per 100,000 to 17.1 per 100,000.
From 1900 to 1943, the suicide rate for females in Japan decreased by an annual average of .23%.
From 1900 to 1943, the suicide rate for males in Japan decreased by an annual average of .27%.
From 1900 to 1943, the respective .23% and .27% average annual decreases in the suicide rates of females and males in Japan were statistically very similar.
Suicides are decreasing at very similar rates among both males and females in Japan because the health of the ether is inexorably improving, and moral and mental health vary directly with the health of the ether.
From 1900 to 1943, the .23% average annual decrease in the suicide rate for females in Japan was 14.8% less than the .27% average annual decrease documented among their male peers.
What’s the variable?
Per Ronald W. Kay in 1994, increased electromagnetic radiation from storms drove suicide among women, while it decreased suicide among men.
Further, from January 1980 to December 1992, per Gordon and Berk, there was a correlation between suicides and average storm activity in South Africa. The effect was 400% greater, or five times greater in females (P <.005) than males (P <.025).
Ergo, the decrease in suicide was markedly smaller among women because of the increasing concentration of low wavelength microwave radiation in the environment in Japan during that time period.
Or you could go with Tadashi Takeshima 2024 study in the New England Journal of Public Policy, wherein he tellingly omitted the increasing rate among Japanese women, versus men, and said “the suicide rate of women was higher than that of European countries. Moreover, female suicides might be attributed to the educational and social status of Japanese women.”
As a career scientist, and as Director of the Kawasaki City Inclusive Rehabilitation Center, and also as the Chairman of the Japan Liaison Committee for Mental Health, he’s desperate to keep you from recognizing low wavelength microwave radiation as the driver of suicide, the latter which is a manifestation of schizophrenia, or what was plainspokenly known in the old days as demonic possession.
I have exposed his duplicity by using what was known in the old days as “fact checking”.
From 1900 to 1943, the suicide rate in Japan decreased by an annual average of .72%.
From 1900 to 1943, the suicide rate in Japan decreased by 30.8%, or by almost one third, from 13 per 100,000 to 9 per 100,000.
From 1900 to 1943, the suicide rate for males in Japan by 11.8%, from 17 per 100,000 to 15 per 100,000.
From 1900 to 1943, the suicide rate for females in Japan decreased by 10%, from 10 per 100,000 to 9 per 100,000. per 100,000.
From 1900 to 1943, the suicide rate for males in Japan increased by 1.2%, from 17 per 100,000 to 17.2 per 100,000.
From 1900 to 1937, the positive variance in suicide among males versus females in Japan decreased by 26.6% versus 1900.
From 1900 to 1937, the positive variance in suicide among males versus females in Japan decreased by an annual average of .72%.
From 1900 to 2025, the suicide rate in Japan increased by an annual average of .1416%.
From 1900 to 2025, the suicide rate in Japan increased by 17.7%, from 13 per 100,000 to 15.3 per 100,000.
In 1900, per the chart in Tadashi Takeshima’s article in the New England Journal of Public Policy, the suicide rate in Japan was 13 per 100,000.
In 1900, per Tadsahi Takeshima, the suicide rate among males in Japan was 17 per 100,000.
In 1900, per the chart in Tadashi Takeshima’s article in the New England Journal of Public Policy, the suicide rate among females in Japan was 10 per 100,000.
In 1900, the suicide rate among males in Japan of 17 per 100,000 was 70% greater, or almost three fourths greater than the rate of 10 per 100,000 among their female peers.
From 1920 to 1943, the suicide rate in Japan decreased by an annual average of .2%.
From 1920 to 1943, the .2% average annual decrease in the suicide rate in Japan was 17.6% greater, or almost one fifth greater than its .17% average annual decrease from 1881 to 1920.
While, in “Long-Term Impact of World War II on Suicide in Japan”, by Tadashi Takeshima, Director, Kawasaki City Inclusive Rehabilitation Center and Chairman, Japan Liaison Committee for Mental Health, published by the New England Journal of Public Policy in November 2024, Tadashi omitted the statistic, and said “even before World War II, Japan was a country with high suicide rates for both men and women.”
It’s sleight-of-hand, a distraction to keep you from recognizing that suicide in Japan was decreasing hyper-exponentially from 1881 to 1943.
I have exposed the duplicity of Tadashi Takeshima by using what was known in the old days as “fact checking”.
He’s desperate to keep you from recognizing that suicides in Japan are decreasing exponentially because the health of the ether is inexorably improving, and moral and mental health vary directly with the health of the ether.
From 1920 to 1943, the suicide rate in Japan decreased by 4.4%, from 18 per 100,000 to 17.2 per 100,000.
In 1920, per the chart, the suicide rate in Japan was 18 per 100,000.
"Annual reports of mental health showed that in the 1920s the suicide rate in Japan was among the highest in the world. In other words, even before World War II, Japan was
a country with high suicide rates for both men and women."
It’s sleight-of-hand, a distraction to keep you from recognizing that suicide in Japan was decreasing steadily from 1881 to 1943.
I have exposed the duplicity of Tadashi Takeshima by using what was known in the old days as “fact checking”.
From 1932 to 1943, the suicide rate in Japan decreased by an annual average of 3.76%.
From 1932 to 1943, the suicide rate in Japan decreased by 41.4%, or by almost half, from 24.1 per 100,000 to 14.1 per 100,000.
In his 2024 study in the New England Journal of Public Policy, Tadashi Takeshima tellingly omitted the percentage because, as a career scientist, and as Director of the Kawasaki City Inclusive Rehabilitation Center, and also as the Chairman of the Japan Liaison Committee for Mental Health, he’s desperate to keep you from recognizing that the health of the ether is inexorably improving, and that moral and mental health vary directly with the health of the ether.
From 1932 to 1943, the 3.76% average annual decrease in the suicide rate in Japan was 2,111.8% greater, or more than twenty two times greater than its .17% average annual decrease from 1881 to 1932.
Given that moral and mental health vary directly with the health of the ether, this hyper-exponential increase in the decrease of the suicide rate in Japan from 1932 to 1943 documents the fact that the health of the ether in Japan was improving exponentially from 1881 all the way up until World War II.
In his 2024 study in the New England Journal of Public Policy, Tadashi Takeshima tellingly omitted the variance, and then omitted the 1881 data from his chart for good measure. That’s because, as a career scientist, and as Director of the Kawasaki City Inclusive Rehabilitation Center, and also as the Chairman of the Japan Liaison Committee for Mental Health, he’s desperate to keep you from recognizing low wavelength microwave radiation as the driver of suicide, the latter which is a manifestation of schizophrenia, or what was plainspokenly known in the old days as demonic possession.
From 1932 to 1938, the suicide rate in Japan decreased by an annual average of 5.68%.
From 1932 to 1938, the suicide rate in Japan decreased by 34.1%, from 21.4 per 100,000 to 14.1 per 100,000.
From 1932 to 1937, the suicide rate in Japan was 21.4 per 100,000.
From 1938 to 1943, the suicide rate in Japan was 14.1 per 100,000.
From 1932 to 1937, per Tadashi Takeshima, the suicide rate for females in Japan was 16.1 per 100,000.
From 1932 to 1937, per Tadashi Takeshima, the suicide rate in Japan was 14.1 per 100,000.
From 1932 to 1937, per Tadashi Takeshima, the suicide rate for males in Japan was 26.6 per 100,000.
From 1932 to 1937, the 65.2% positive variance in suicide among males versus females in Japan was 6.9% less than its 70% positive variance in 1900.
Here, in just under forty years, females in Japan have narrowed the suicide gap versus their male peers by over one fourth. Why?
Per Ronald W. Kay in 1994, increased electromagnetic radiation from storms drove suicide among women, while it decreased suicide among men.
Further, from January 1980 to December 1992, per Gordon and Berk, there was a correlation between suicides and average storm activity in South Africa. The effect was 400% greater, or five times greater in females (P <.005) than males (P <.025).
Ergo, the suicide gap between men and women in Japan narrowed by almost one fifth from 1937 to 1943 because of the increasing concentration of low wavelength microwave radiation in the environment in Japan during that time period.
In his 2024 study in the New England Journal of Public Policy, Tadashi Takeshima tellingly omitted the percentage because, as a career scientist, and as Director of the Kawasaki City Inclusive Rehabilitation Center, and also as the Chairman of the Japan Liaison Committee for Mental Health, he’s desperate to keep you from recognizing low wavelength microwave radiation as the driver of suicide, the latter which is a manifestation of schizophrenia, or what was plainspokenly known in the old days as demonic possession.
I say that because, in 2019, the 10% suicide rate among schizophrenics in the United States was 71,842% greater than the rate of .0139% among the general populace.
From 1932 to 1937, the suicide rate of 26.6 per 100,000 among males in Japan was 65.2% greater, or almost two thirds greater than the rate of 16.1 per 100,000 among their female peers.
In 1932, per Tadashi Takeshima, the suicide rate in Japan was 14.1 per 100,000.
From 1937 to 1943, the suicide rate for females in Japan decreased by 31%, or by almost one third, from 16.1 per 100,000 to 11.1 per 100,000.
In his 2024 study in the New England Journal of Public Policy, Tadashi Takeshima omitted the percentage, and said in comment that “it decreased significantly from 1938 until 1943.”
Those are examples of the propaganda technique known as “stonewalling”.
Given that moral and mental health vary directly with the health of the ether, then here we see the health of the ether in Japan increasing significantly from 1937 to 1943.
From 1937 to 1943, the suicide rate for males in Japan decreased by 35.3%, or by more than one third, from 26.6 per 100,000 to 17.2 per 100,000.
In his 2024 study in the New England Journal of Public Policy, Tadashi Takeshima omitted the percentage, and said in comment that “it decreased significantly from 1938 until 1943.”
Those are examples of the propaganda technique known as “stonewalling”.
Given that moral and mental health vary directly with the health of the ether, then here we see the health of the ether in Japan increasing significantly from 1937 to 1943.
As a career scientist, and as Director of the Kawasaki City Inclusive Rehabilitation Center, and also as the Chairman of the Japan Liaison Committee for Mental Health, Tadashi tellingly omitted the statistic documenting the magnitude of the decrease in the suicide rate of males in Japan because he’s desperate to keep you from recognizing that the health of the ether is inexorably improving, and that moral and mental health vary directly with the health of the ether.
From 1937 to 1943, the positive variance in suicide among males versus females in Japan decreased by an annual average of 2.01%.
From 1937 to 1943, the 31% decrease in the suicide rate among females in Japan was 12.1% less than the 35.3% decrease in the suicide rate for their male peers.
In his 2024 study in the New England Journal of Public Policy, Tadashi Takeshima tellingly omitted the variance because, as a career scientist, and as Director of the Kawasaki City Inclusive Rehabilitation Center, and also as the Chairman of the Japan Liaison Committee for Mental Health, he’s desperate to keep you from recognizing low wavelength microwave radiation as the driver of suicide, the latter which is a manifestation of schizophrenia, or what was plainspokenly known in the old days as demonic possession.
I say that because, in 2019, the 10% suicide rate among schizophrenics in the United States was 71,842% greater than the rate of .0139% among the general populace.
Here’s a picture of the serially-data-omitting career scientist Tadashi Takashima, in a Satanic-purple tie.

(Tadashi Takeshima, Director of the Kawasaki City Inclusive Rehabilitation Center, and also as the Chairman of the Japan Liaison Committee for Mental Health)
I have included Tadashi Takeshima’s picture so that you could get a better idea of what a generational Satanist Freemason of marginal influence looks like.
They are all related to one another through the maternal bloodline. Generational Satanists comprise between twenty and thirty percent of the populace, and are hiding in plain sight in every city, town and village on Earth. It’s how the few have controlled the many all the way back to Babylon, and before.
But they say that the hardest part of solving a problem is recognizing that you have one.
Don Croft used to say “Parasites fear exposure above all else”.
How long do you think that these people have left in power, now?
Please consider doing what you can to help speed the transition.
From 1937 to 1943, the positive variance in the suicide rate among males versus females in Japan decreased by 15.6%, from 65.2% to 55%.
Here, in just six years from 1937 to 1943, females in Japan have narrowed the suicide gap versus their male peers by almost one fifth. Why?
Per Ronald W. Kay in 1994, increased electromagnetic radiation from storms drove suicide among women, while it decreased suicide among men.
Further, from January 1980 to December 1992, per Gordon and Berk, there was a correlation between suicides and average storm activity in South Africa. The effect was 400% greater, or five times greater in females (P <.005) than males (P <.025).
Ergo, the suicide gap between men and women in Japan narrowed by almost one fifth from 1937 to 1943 because of the increasing concentration of low wavelength microwave radiation in the environment in Japan during that time period.
From 1937 to 1943, the 2.01% average annual decrease in the positive variance in suicide among males versus females in Japan was 179.1% greater, or almost three times greater than its .72% average annual decrease from 1900 to 1937.
Per Ronald W. Kay in 1994, increased electromagnetic radiation from storms drove suicide among women, while it decreased suicide among men.
Further, from January 1980 to December 1992, per Gordon and Berk, there was a correlation between suicides and average storm activity in South Africa. The effect was 400% greater, or five times greater in females (P <.005) than males (P <.025).
Ergo, the suicide gap between women and men in Japan decreased exponentially from 1900 to 1943 because of the increasing concentration of low wavelength microwave radiation in the environment in Japan during that time period.
Moral and mental health vary directly with the health of the ether.
In 1937, per Tadashi Takeshima, the suicide rate in Japan was 14.1 per 100,000.
From 1938 to 1943, per Tadashi Takeshima, the suicide rate for females in Japan was 11.1 per 100,000.
From 1938 to 1943, per Tadashi Takeshima, the suicide rate for males in Japan was 17.2 per 100,000.
From 1938 to 1943, the suicide rate for males in Japan of 17.2 per 100,000 was 55% greater, or more than half again greater than the rate of 11.1 per 100,000 among their female peers.
From 1943 to 2025, the .14% average annual increase in the suicide rate in Japan was 80.5% less than its .72% average annual increase from 1900 to 1943.
Given that moral and mental health vary directly with the health of the ether, this statistic shows the health of the ether in Japan improving exponentially from 1943 to 2025.
From 1943 to 2000, the suicide rate in Japan increased by 108.3%, or by more than two times, from 12 per 100,000 to 25 per 100,000.
From 1943 to 2000, the suicide rate among males in Japan remained unchanged, at 15 per 100,000.
From 1943 to 2000, the suicide rate among females in Japan increased by 55.5%, or by more than half, from 9 per 100,000 to 14 per 100,000. Rates among males remained unchanged.
From 1943 to 2000, the suicide rate among females in Japan increased by an annual average of .97%
From 1943 to 2000, the .97% average annual increase in the suicide rate among females in Japan was infinitely greater than the unchanged suicide rate among males.
From 1943 to 1960, the suicide rate in Japan increased by an annual average of 12.2%.
From 1943 to 1960, the suicide rate in Japan increased by 207.7%, or by more than three times, from 9 per 100,000 to 27.7 per 100,000.
From 1943 to 1960, the 12.2% average annual increase in the suicide rate in Japan was 1,794.4% greater, or more than eighteen times greater than its .72% average annual decrease from 1900 to 1943.
This hyper-exonential increase in suicides in Japan from 1943 to 1960 was driven by the Death energy generated during World War II, the Death energy generated by the detonation of atomic bombs at Hiroshima and Nagasaki, and, lastly, the ever-increasing proliferation of the low wavelength microwave radiation from what we collectively refer to as “technology”.
In 1943, per the chart in Tadashi Takeshima’s article published in the New England Journal of Public Policy in 2024, the suicide rate for females in Japan was 9 per 100,000.
In 1943, per the chart in Tadashi Takeshima’s article published in the New England Journal of Public Policy in 2024, the suicide rate in Japan was 12 per 100,000.
In 1943, per the chart in Tadashi Takeshima’s article published in the New England Journal of Public Policy in 2024, the suicide rate for males in Japan was 15 per 100,000.
From 1960 to 1995, the suicide rate in Japan decreased by an annual average of 1%.
From 1960 to 1995, the suicide rate in Japan decreased by 38.3%, or by almost one third, from 27.7 per 100,000 to 17.1 per 100,000.
Given that moral and mental health vary directly with the health of the ether, this statistic shows that the health of the ether in Japan was improving exponentially from 1960 to 1995.
In 1960, per the National Institute of Health, the suicide rate in Japan was 27.7 per 100,000.
From 1960 until 1995, the crude suicide mortality rate in Japan decreased from 27.7 [20] to 17.1 per 100,000 before increasing suddenly in 1998 to a rate of 25.3 per 100,000. Previous studies have reported that this increase may be closely related to unemployment and economic hardship during the same period [21]. However, it is possible that these changes reflect aging or changes in the distribution of methods of suicide.
From 1960 to 1978, the suicide rate in Japan decreased by an annual average of 1.94%.
From 1960 to 1978, the suicide rate in Japan decreased by 35%, or by more than one third, from 27.7 per 100,000 to 18 per 100,000.
In 1976, the 2.39% incidence of Schizophrenia in Sweden was 2,290% greater, or more than twenty three times greater than its .10% incidence among natives of Kenya.
This statistic documents the fact that schizophrenia is an inherited condition of the distinct and seperate caucasian species of human which we known as H. neanderthalensis.
From 1978 to 1983, the suicide rate in Japan increased by an annual average of 5.7%.
From 1978 to 1983, the 5.7% average annual increase in the suicide rate in Japan was 400% greater, or five times greater than its 1.94% average annual decrease from 1960 to 1978.
Here, from 1978 to 1983, we see a hyper-exponential increase in suicide driven by the low wavelength microwave radiation from what we collectively refer to as technology, which is degrading the health of the ether at a rate exponentially greater than the rate at which the health of the ether is improving over the long term on the way to the end of the Mayan “long count” in 2012.
From 1978 to 1983, the suicide rate in Japan increased by 17.2%, from 18 per 100,000 to 21.1 per 100,000.
In 1978, per nbakki.hatenblog.com, the suicide rate in Japan was 18 per 100,000.
In 1978, per nbakki.hatenblog.com, the suicide rate among males in Japan was 22.7 per 100,000, or .0227%.
In 1978, per nbakki.hatenblog.com, the suicide rate among females in Japan was 13.6 per 100,000, or .0136%.
In 1978, the suicide rate among males in Japan of 22.7 per 100,000 was 66.9% greater than the rate of 13.6 per 100,000 among their male peers.
In 1978, the 66.9% positive variance in the suicide rate in Japan among males versus females was 4.4% less than its 70% positive variance in 1900.
From January 1980 to December 1992, per Gordon and Berk, there was a correlation between suicides and average storm activity in South Africa. The effect was 400% greater, or five times greater in females (P <.005) than males (P <.025).
This demonstrates that the purportedly harmless low wavelength microwave radiation from what we collectively refer to as technology drives schizophrenia, or what used to be plainspokenly referred to in the old days as demonic possession, and that the efffect is exponentially greater among females than it is among males.
Gordon and Berk omitted the statistic, and referred to it with the hedging generality “stronger in females”.
That is an example of the propaganda technique known as “stonewalling”.
In 1983, per nbakki.hatenablog.com, the suicide rate in Japan was 21.1 per 100,000.
In 1994, Cambridge University Press published “Geomagnetic Storms: Association with Incidence of Depression as Measured by Hospital Admission”, by first author Ronald W. Kay, which showed that increased electromagnetic radiation from storms drove suicide among women, while it decreased suicide among men.
Mr. Kay described it as “interesting”, and offered no suggestation as to why that might have been the case.
Those are examples of the propaganda technique known as “stonewalling”.
From 1983 to 2000, the suicide rate in Japan increased by an annual average of 1%.
From 1983 to 2000, the suicide rate in Japan increased by 18.4%, or by almost one fifth, from 21.1 per 100,000 to 25 per 100,000.
In 1983, per nbakki.hatenablog.com, the suicide rate in Japan was 21.1 per 100,000.
From 1995 to 1998, the suicide rate in Japan increased by an annual average of 16%.
From 1995 to 1998, the 16% average annual increase in the suicide rate in Japan was 1,700% greater, or more than eighteen times greater than its 1% average annual decrease from 1960 to 1995.
This is the direct result of the sudden erection of what we collectively refer to as “cell phone towers” in every city, town and village on Earth in the mid- to late-1990’s.
From 1995 to 1998, the 16% average annual increase in the suicide rate in Japan was 4,748% greater, or more than forty eight times greater than its .33% average annual increase from 1900 to 1995.
This is the direct result of the sudden erection of what we collectively refer to as “cell phone towers” in every city, town and village on Earth in the mid- to late-1990’s.
From 1995 to 1998, the suicide rate in Japan increased by 47.9%, or by almost half, from 17.1 per 100,000 to 25.3 per 100,000.
In 1995, per the National Institute of Health, the suicide rate in Japan was 17.1 per 100,000.
In 1998, per the National Institute of Health, the suicide rate in Japan was 25.3 per 100,000.
From 1999 to 2012, the suicide rate in Japan decreased by an annual average of 1.3%.
From 1999 to 2012, the suicide rate in Japan decreased by 16.5%, from 26.1 per 100,000 to 21.8 per 100,000.
In 1999, per nbakki.hatenablog.com, the suicide rate in Japan was 26.1 per 100,000.
In 2000, per the chart in Tadashi Takeshima’s article published in the New England Journal of Public Policy in 2024, the suicide rate in Japan was 25 per 100,000.
In 2000, per the chart in Tadashi Takeshima’s article published in the New England Journal of Public Policy in 2024, the suicide rate among males in Japan was 37 per 100,000.
In 2000, per the chart in Tadashi Takeshima’s article published in the New England Journal of Public Policy in 2024, the suicide rate among females in Japan was 14 per 100,000.
In 2000, the suicide rate among males in Japan of 37 per 100,000 was 164.2% greater, or more than one and a half times greater than the rate of 14 per 100,000 among their female peers.
From 2012 to 2018, the suicide rate in Japan decreased by an annual average of 3.8%.
From 2012 to 2018, the suicide rate in Japan decreased by 22.7%, from 21.8 per 100,000, or .022%, to 16.87 per 100,000, or .017%.
From 2012 to 2018, the 3.8% average annual decrease in the suicide rate in Japan was 192.3% greater, or almost three times greater than its 1.3% average annual decrease from 1999 to 2012.
Here, from 2012 to 2018, coming out of the end of the Mayan “long count” in 2012, we see the health of the ether improving at a rate exponentially greater than that at which technology is able to degrade it.
From 2012 to 2018, the 3.8% average annual decrease in the suicide rate in Japan was 533.3% greater, or more than six times greater than its .6% average annual increase from 1900 to 2012.
Here, from 2012 to 2018, coming out of the end of the Mayan “long count” in 2012, we see the health of the ether improving at a rate exponentially greater than that at which technology is able to degrade it.
In 2012, per nbakki.hatenablog.com, the suicide rate in Japan was 21.8 per 100,000.
In 2012, per nbakki.hatenablog.com, the suicide rate among males in Japan was 31.1 per 100,000.
In 2012, per nbakki.hatenablog.com, the suicide rate among females in Japan was 13.1 per 100,000.
From 2018 to 2024, the suicide rate in Japan decreased by an annual average of .5%.
From 2018 to 2024, the suicide rate in Japan decreased by 2.8%
From 2018 to 2024, the suicide rate in Japan decreased by 2.8%, from 16.87 per 100,000 to 16.4 per 100,000, the second lowest in history.
From 2018 to 2024, the .21% average annual increase in the suicide rate in Japan was 16% less, or almost one fifth less than its .25% average annual increase from 1900 to 2018.
From 2018 to 2024, the .5% average annual decrease in the suicide rate in Japan was 300% greater, or four times greater than its .25% average annual increase from 1900 to 2018.
Here, from 2018 to 2024, coming out of the end of the Mayan “long count” in 2012, we see the health of the ether improving at a rate exponentially greater than that at which technology is able to degrade it.
In 2018, per macrotrends.net, the suicide rate in Japan was 16.87 per 100,000.
From 2023 to 2025, suicides in Japan decreased by 12.7%, or by 2,740 suicides, from 21,837 to 19,097.
From 2023 to 2024, suicides in Japan decreased by 7.2%, or by 1,569 suicides, from 21,837 to 20,268.
In 2023, per asahi.com, 21,837 people committed suicide in Japan.
In 2024, per nippon.com, there were 20,268 suicides in Japan, the second lowest on record.
In 2024, per statista.com, the suicide rate in Japan was 16.4 per 100,000.
From 2024 to 2025, suicides in Japan decreased by 5.7%, or by 1,223 suicides, from 20,268 to 19,097.
From 2024 to 2025, the suicide rate in Japan decreased by 6.7%, from 16.4 per 100,000 to 15.3 per 100,000.
From 2024 to 2025, the 6.7% decrease in the suicide rate in Japan was 3,290% greater, or more than thirty three times greater than its .21% average annual increase from 1900 to 2024.
Given that moral and mental health vary directly with the health of the ether, this statistic proves that the health of the ether in Japan improved hyper-exponentially from 2024 to 2025.
From 2024 to 2025, the 6.7% decrease in the suicide rate in Japan was 33,400% greater, or more than three hundred times greater than its .02% average annual decrease from 1881 to 2025.
Given that moral and mental health vary directly with the health of the ether, this statistic proves that the health of the ether in Japan improved hyper-exponentially from 2024 to 2025.
In November 2024, the New England Journal of Public Policy published “Long-Term Impact of World War II on Suicide in Japan”, by Tadashi Takeshima, Director, Kawasaki City Inclusive Rehabilitation Center and Chairman, Japan Liaison Committee for Mental Health.
In 2025, per nippon.com, there were 19,097 suicides in Japan, This was a decrease of 1,223 from the previous year and marked the third successive annual decrease. standing below 20,000 for the first time since the statistics began in 1978.
In 2025, news.ycombinator.com the suicide rate in Japan was 15.3 per 100,000.
In 2025, per ycombinator.com, the suicide rate in the United States was 16.1 per 100,000.
Jeff Miller, Honolulu, HI, February 18, 2026
If you’d like to be added to this free mailing list, or know someone who would be, please send me a note at [email protected].